Research
FINISHED STUDY
A Meteor Shockwave Event Recorded at Seismic and Infrasound Stations in Northern Taiwan [Published]
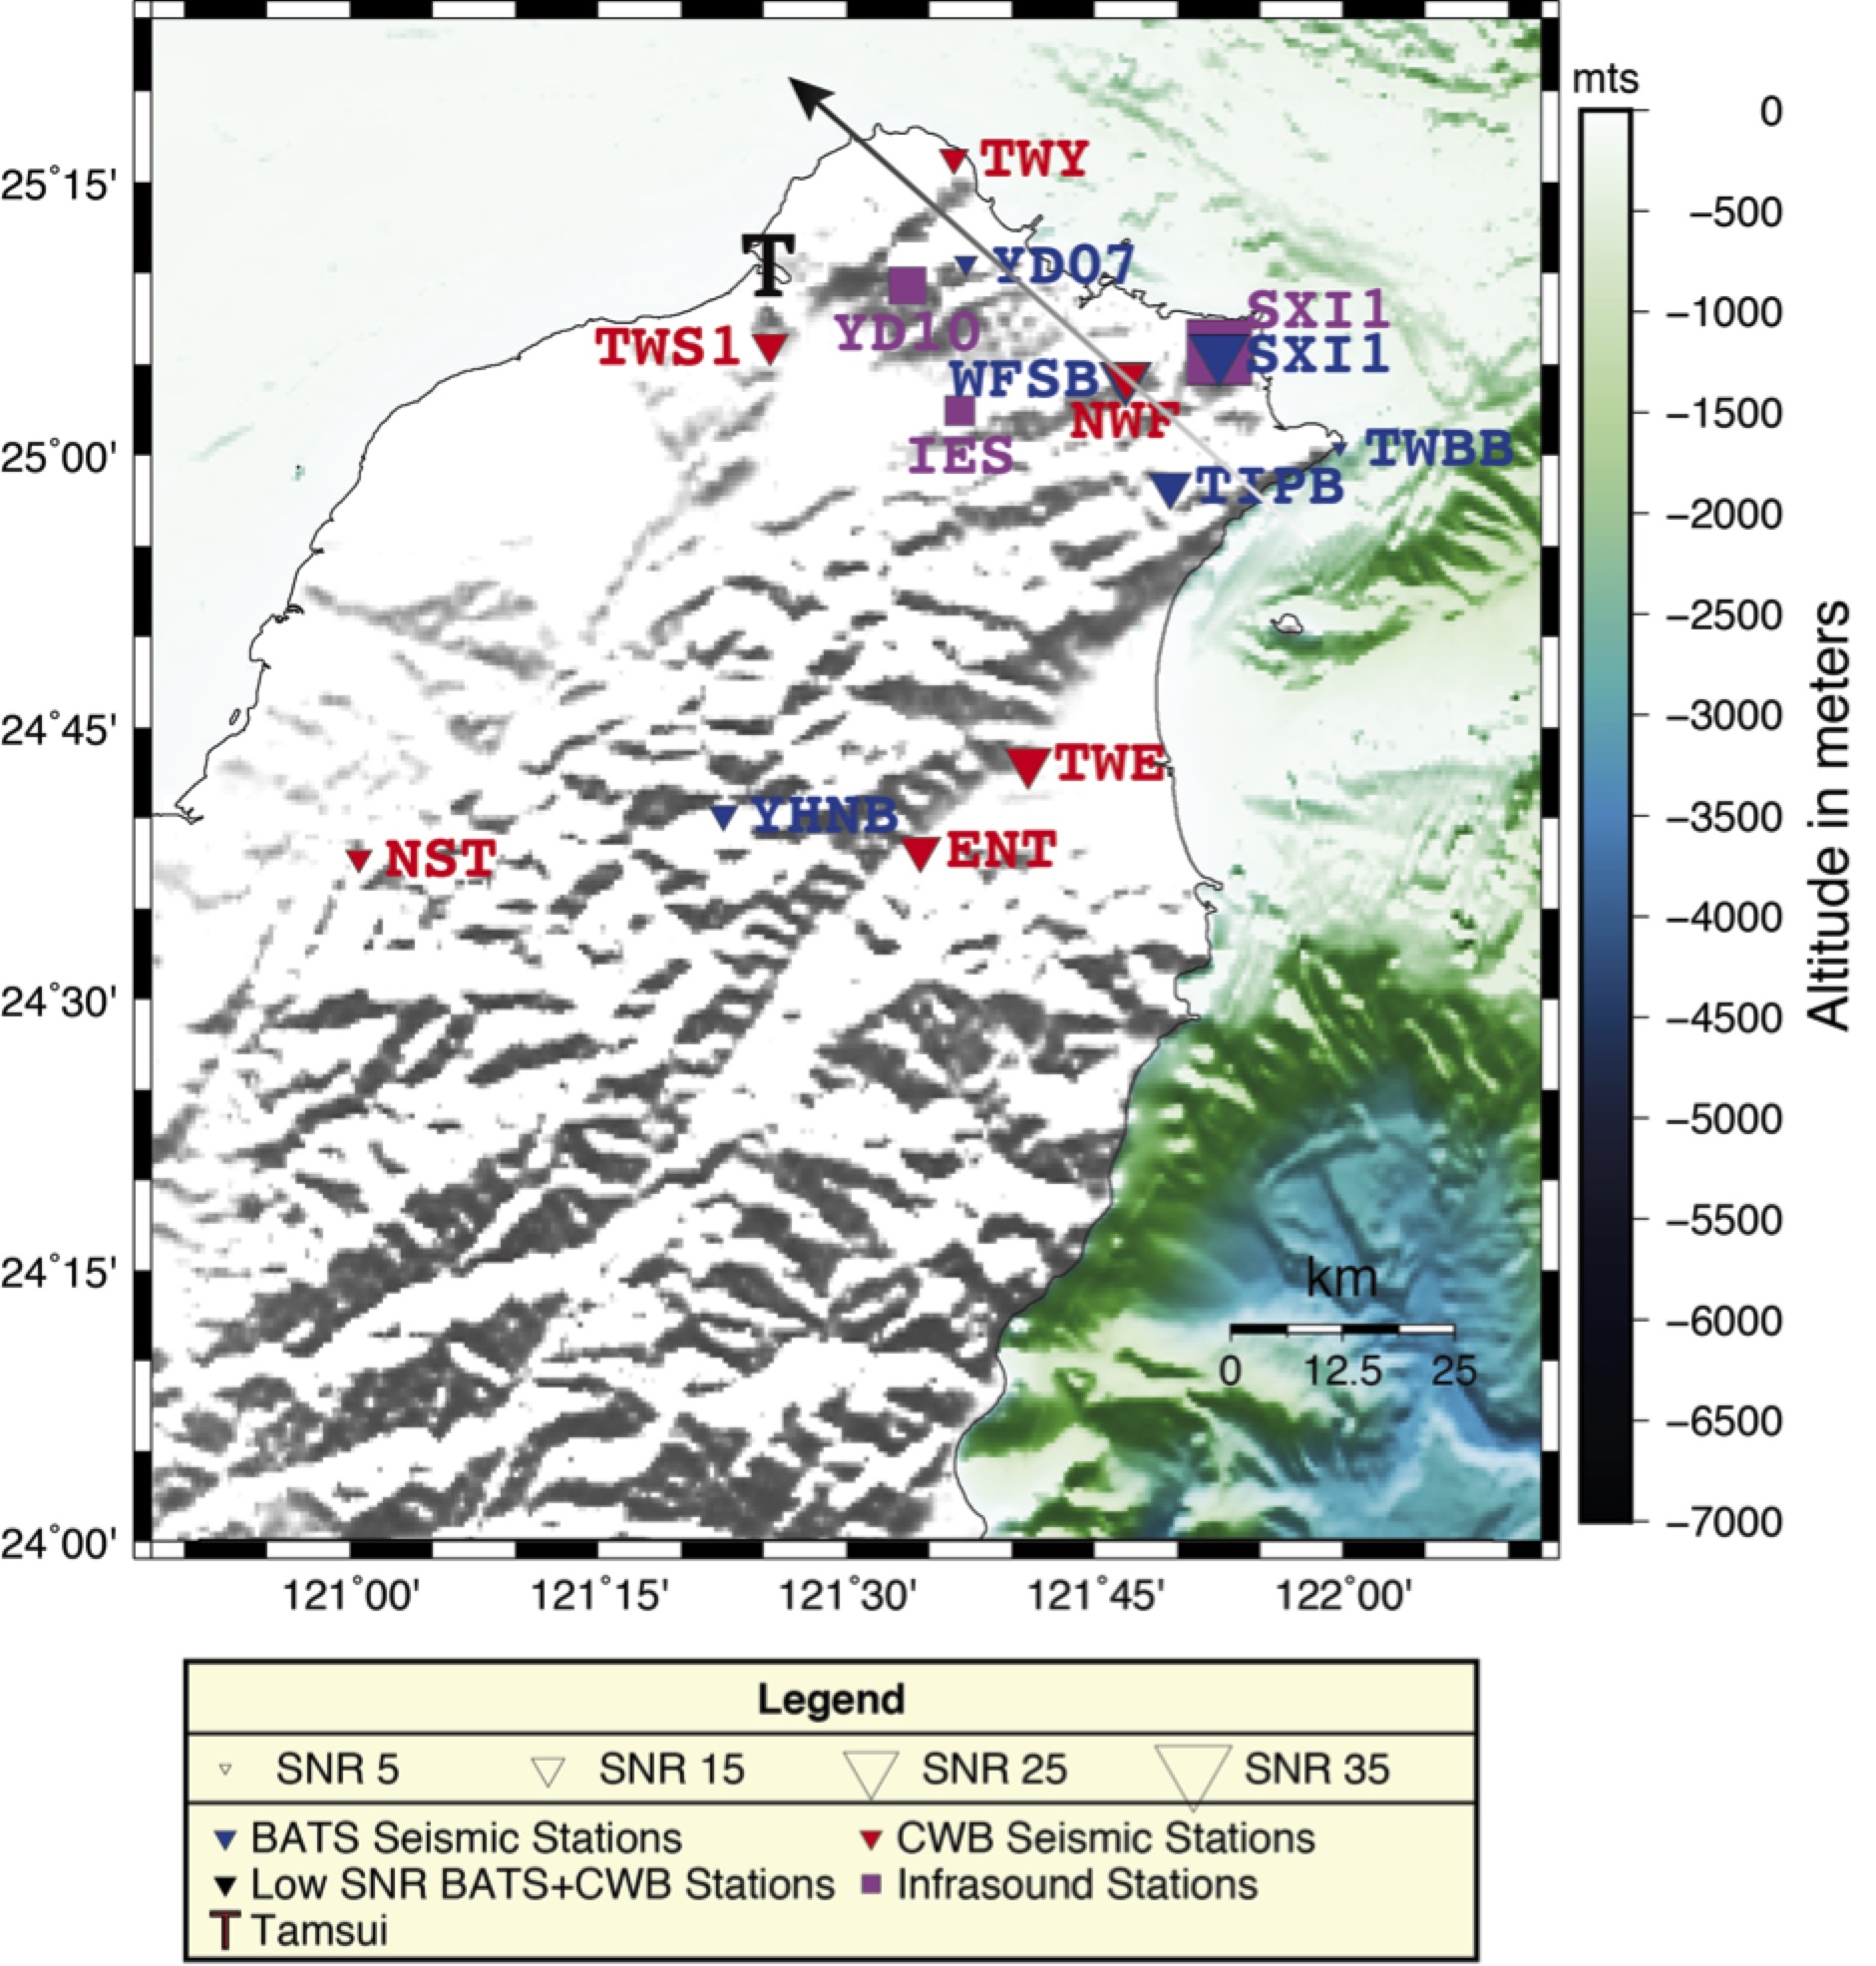
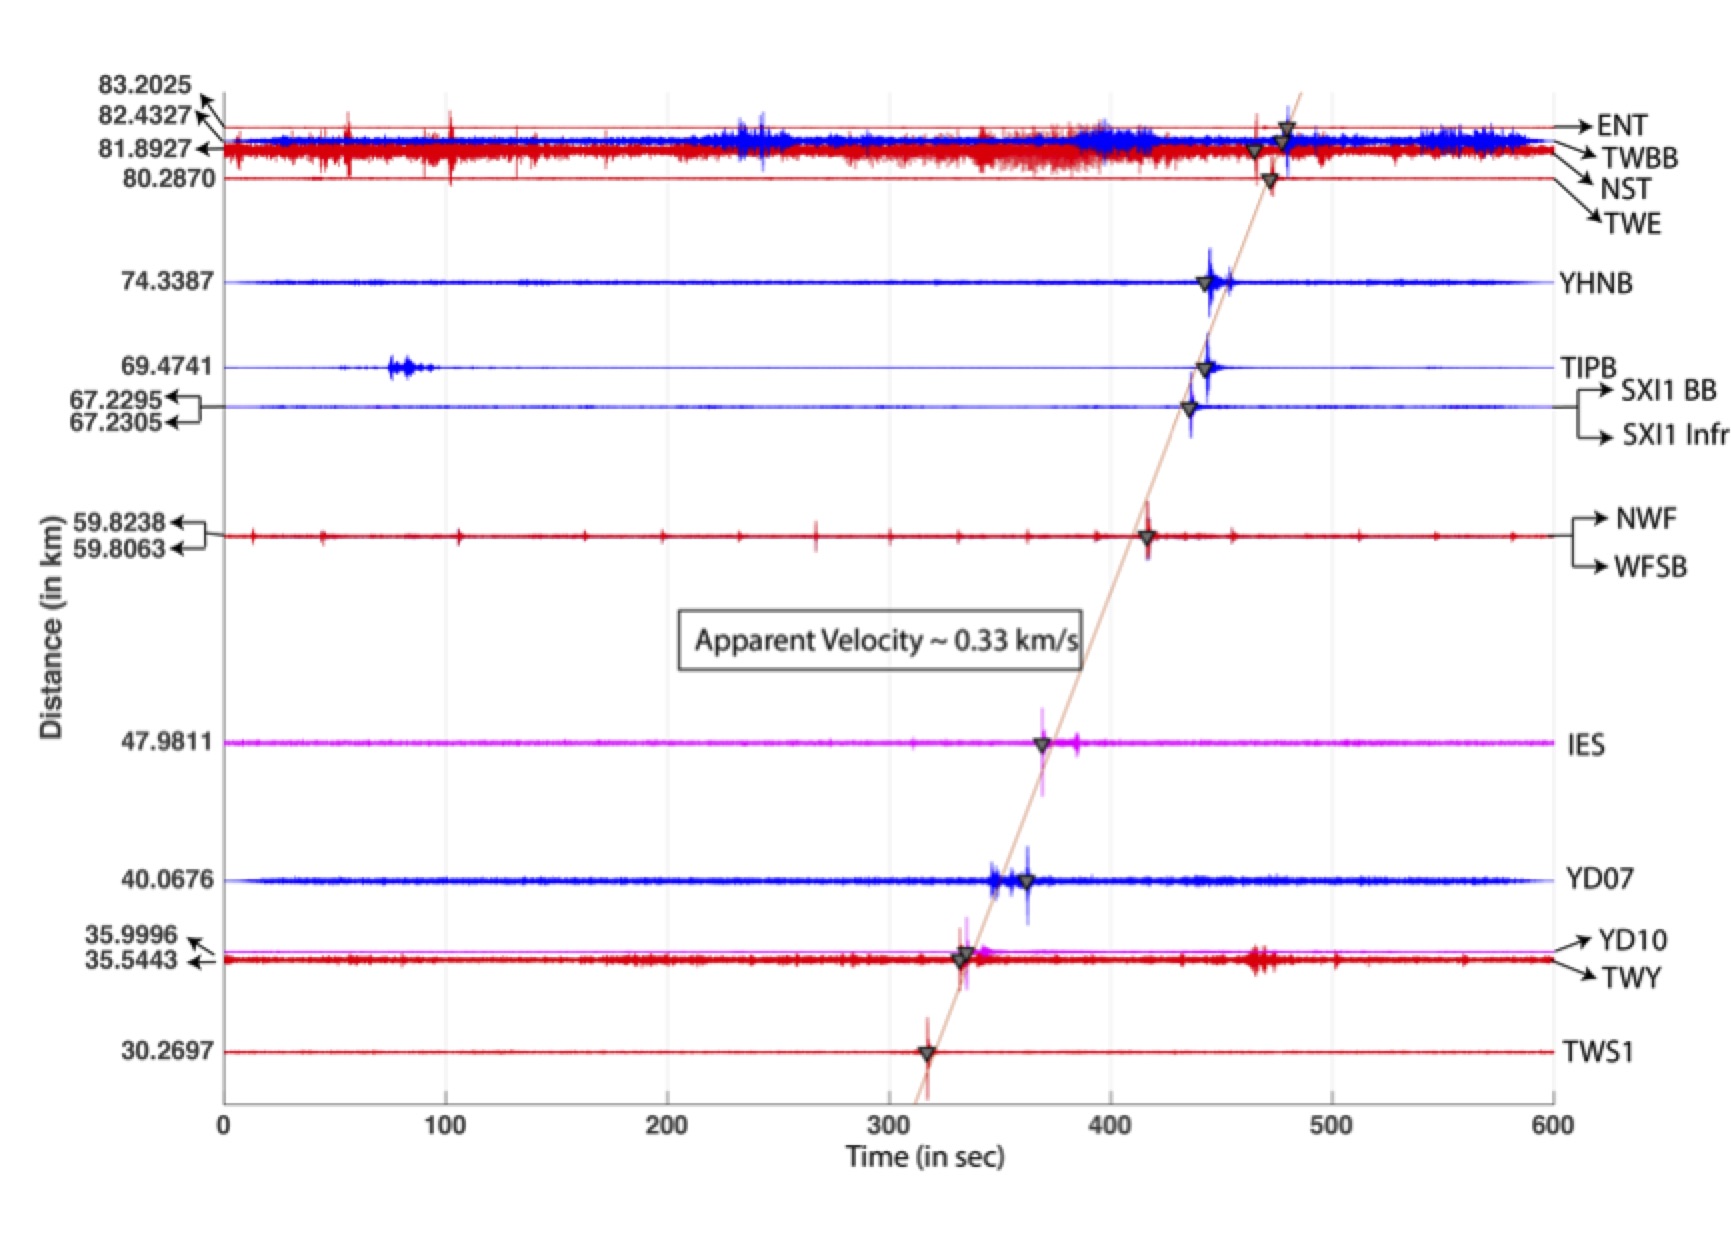
Three mysterious explosion sounds were heard in the coastal towns of Tamsui, west of Taipei in northern Taiwan, in the early evening of December 5, 2013. The event left clear signals that are identified in the recordings of 12 regional seismometers and 3 infrasound sensors and processed by means of travel time analysis. The apparent velocity of \( ∼ 330 m/s \) of the signals confirms that the energy transmission was through the atmosphere, and the characteristics of the waveforms suggest the meteor-generated shockwaves. We use the graphical method as well as the Genetic Algorithm optimization approach to constrain the trajectory of the meteor and to locate its projected intercept with the ground \( (25.33 N, 121.26 E) \), approximately 20 km off the coast of Tamsui. The trajectory has azimuth (measured from north in a map view in the clockwise direction) of \( 303^{\circ} \) and (near-vertical) elevation angle of \( 70^{\circ} \). From the observed period of 1.3 s at the maximum amplitude of the infrasound signal, we estimate by conventional scaling law that the meteor in question had impact energy on the order of \( 5 \times 10^{10} \) J (equivalent to an earthquake of local magnitude 4) or roughly a size of \( ∼ 0.5 \) m across.
Anisotropic Rayleigh Wave Phase Velocity Maps of Gujarat, India [Manuscript in Preparation]
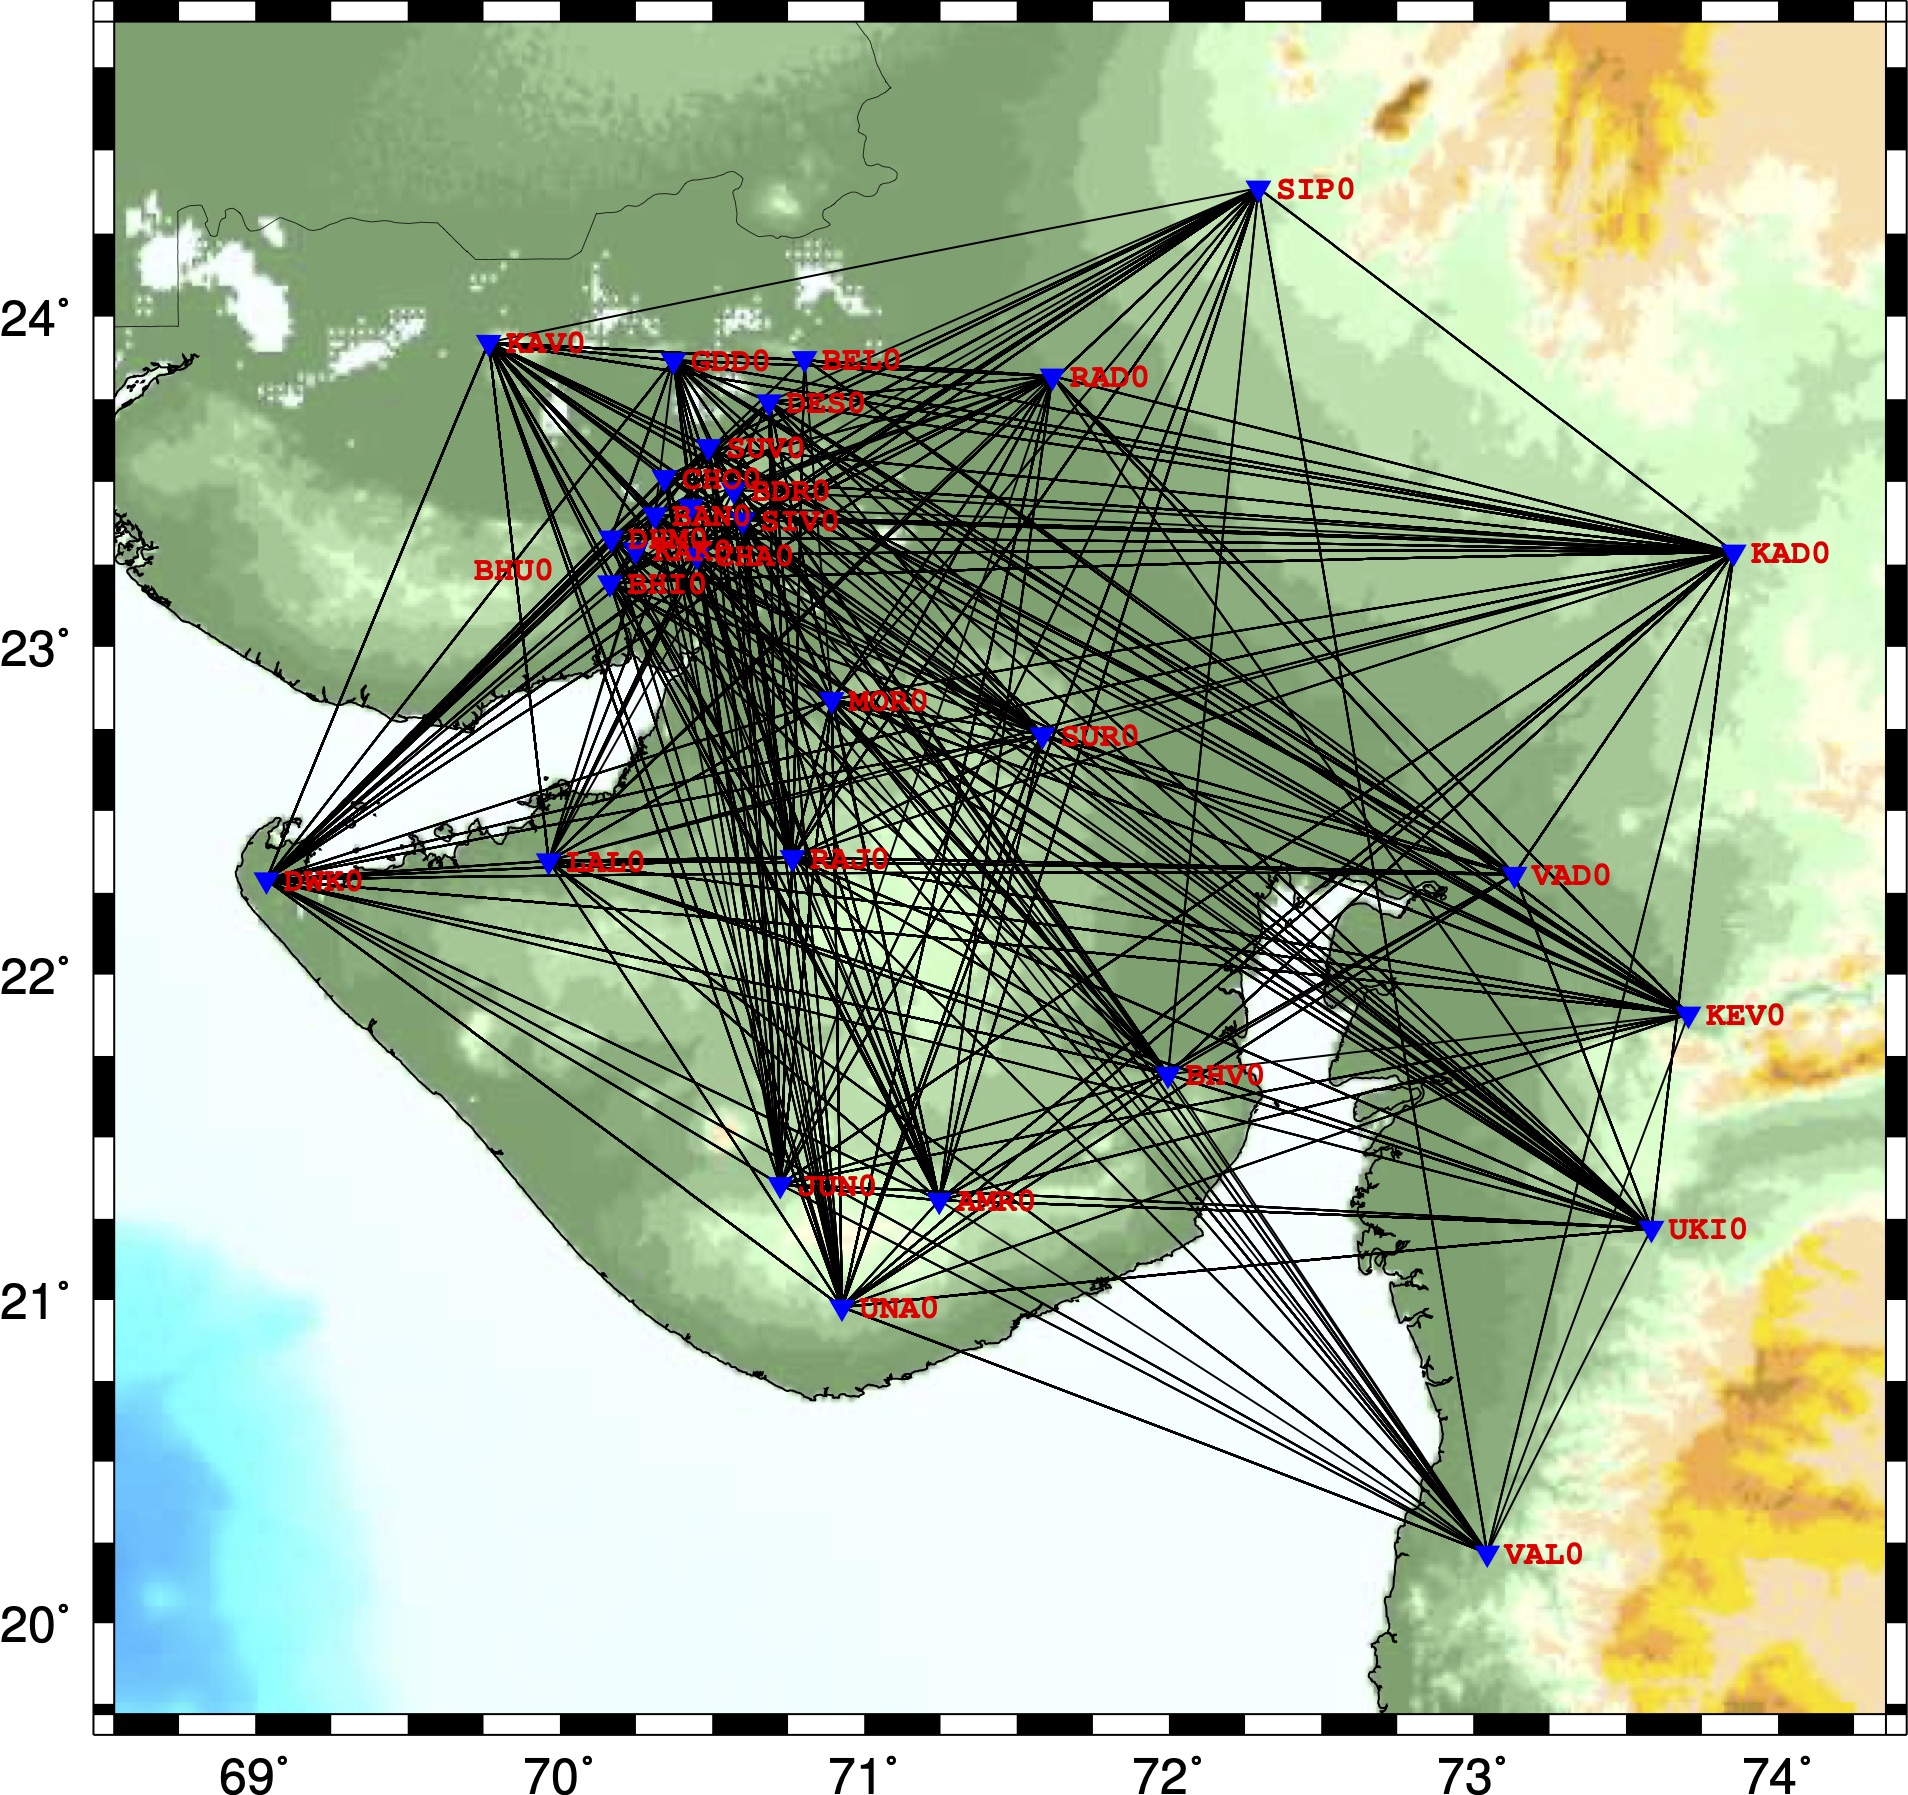
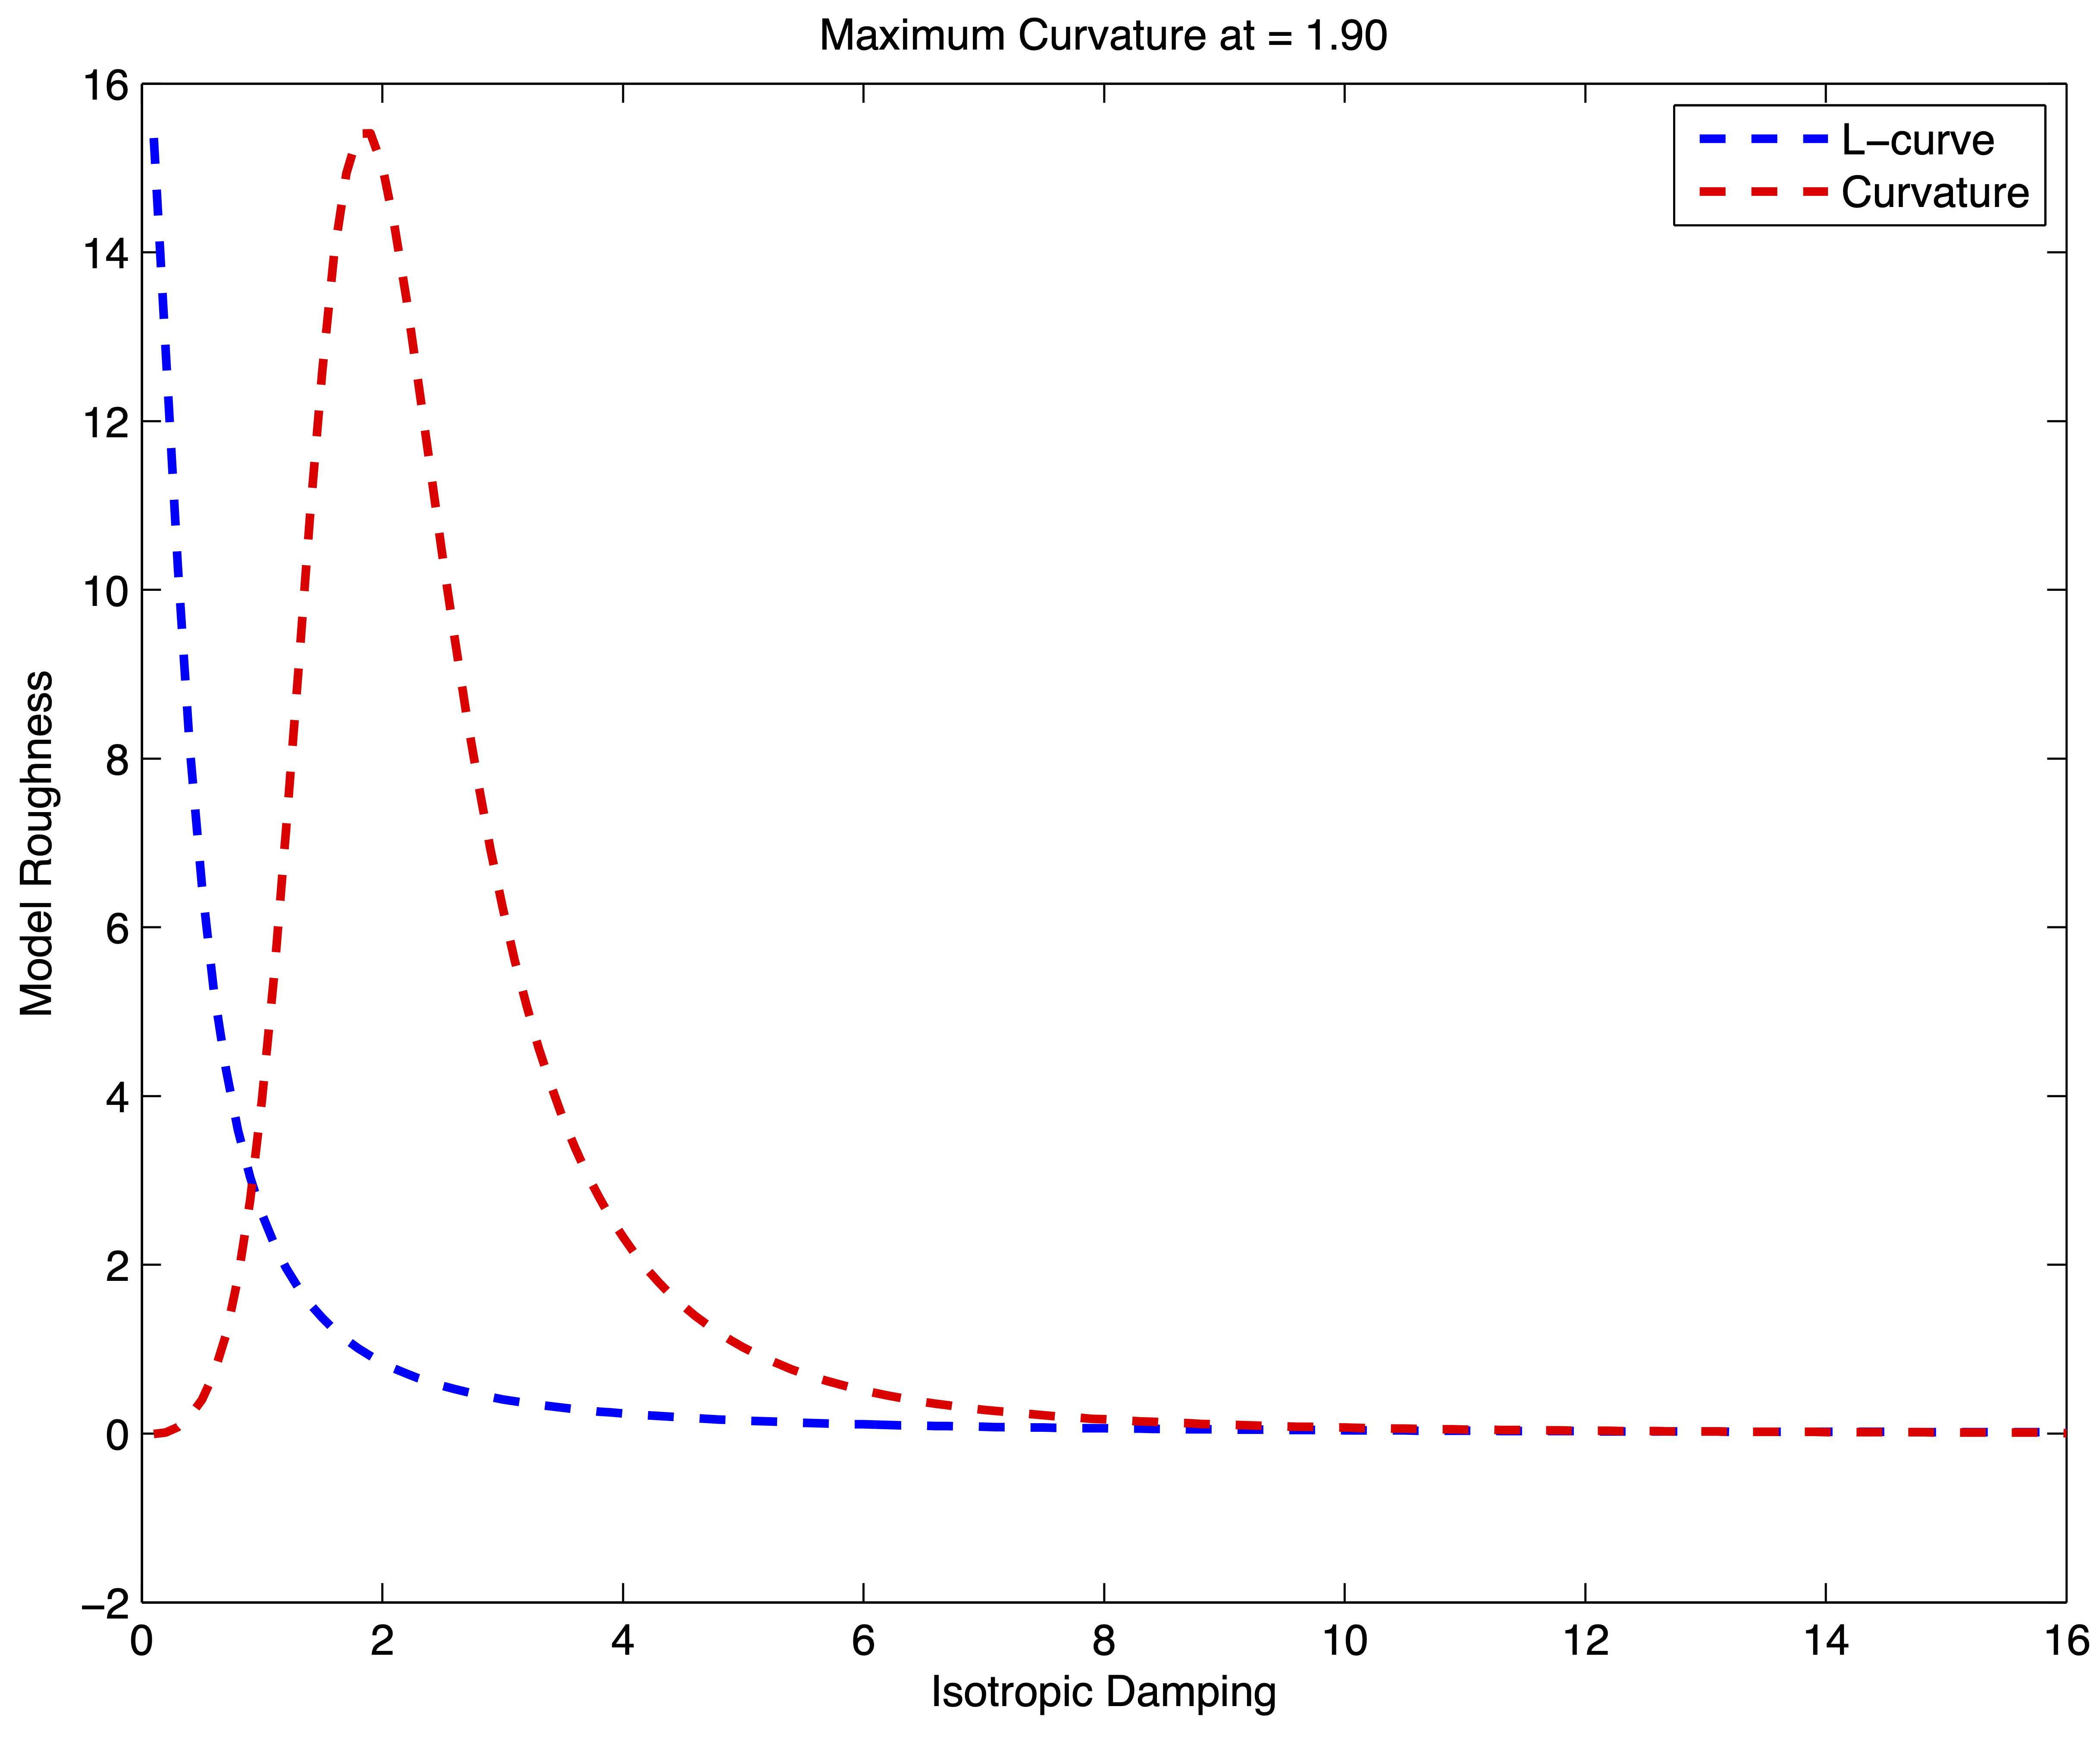
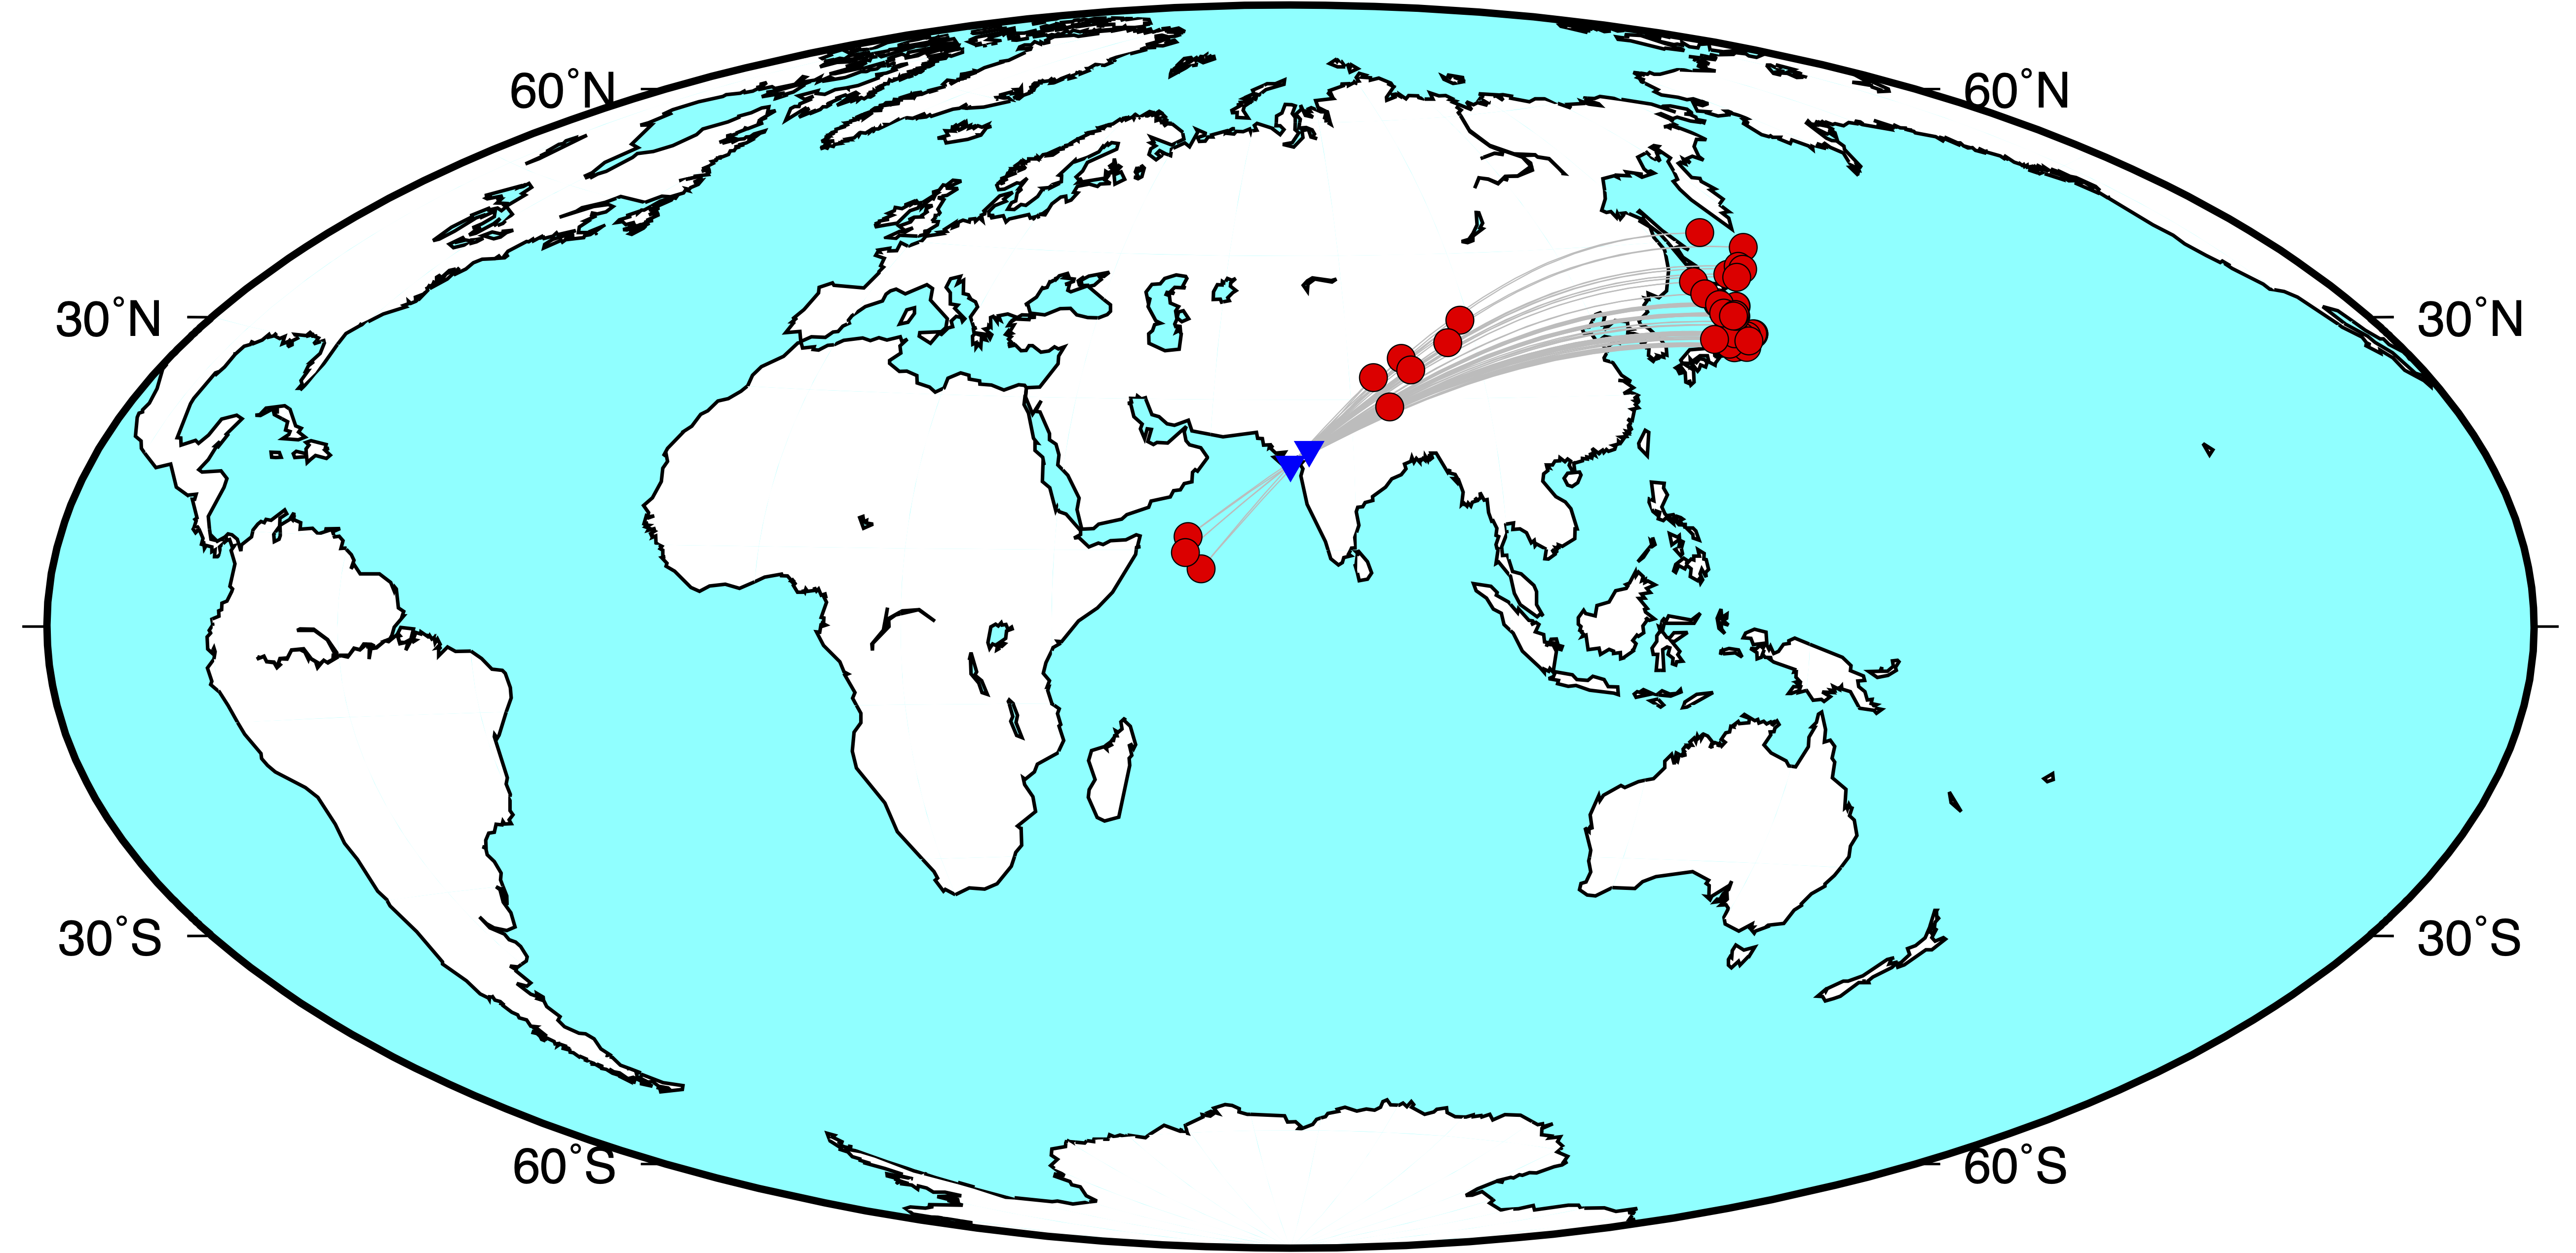
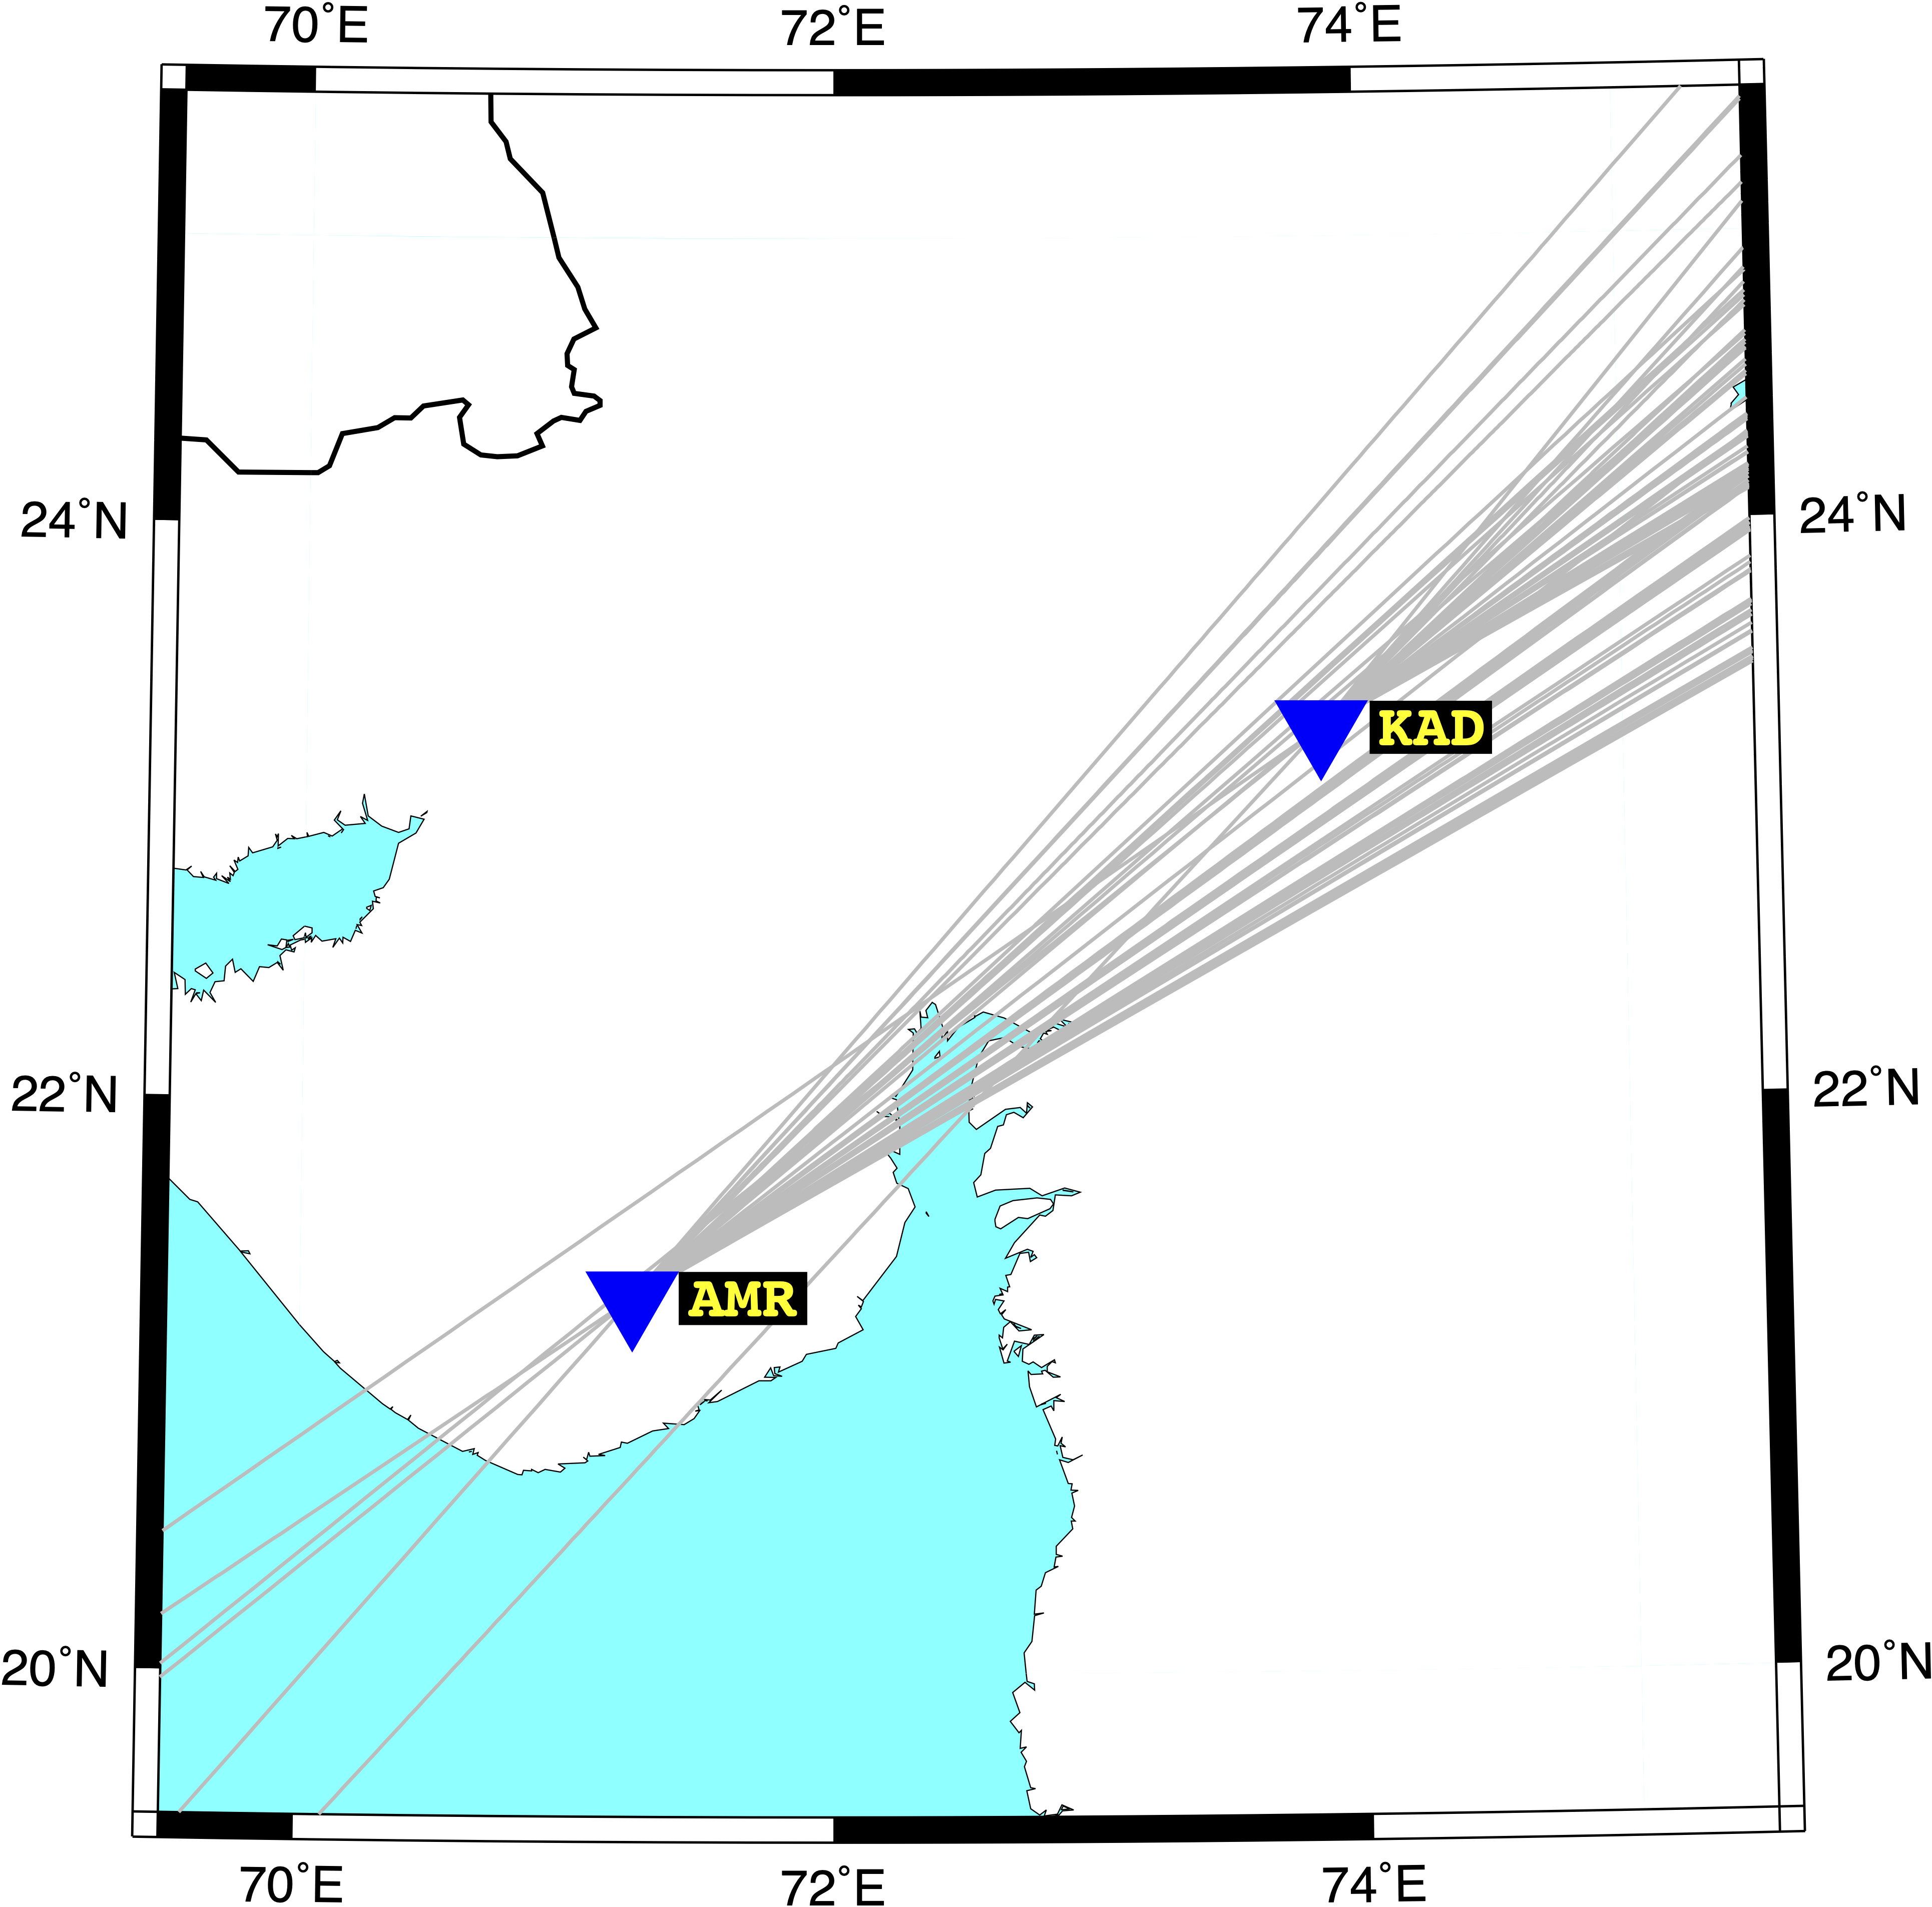
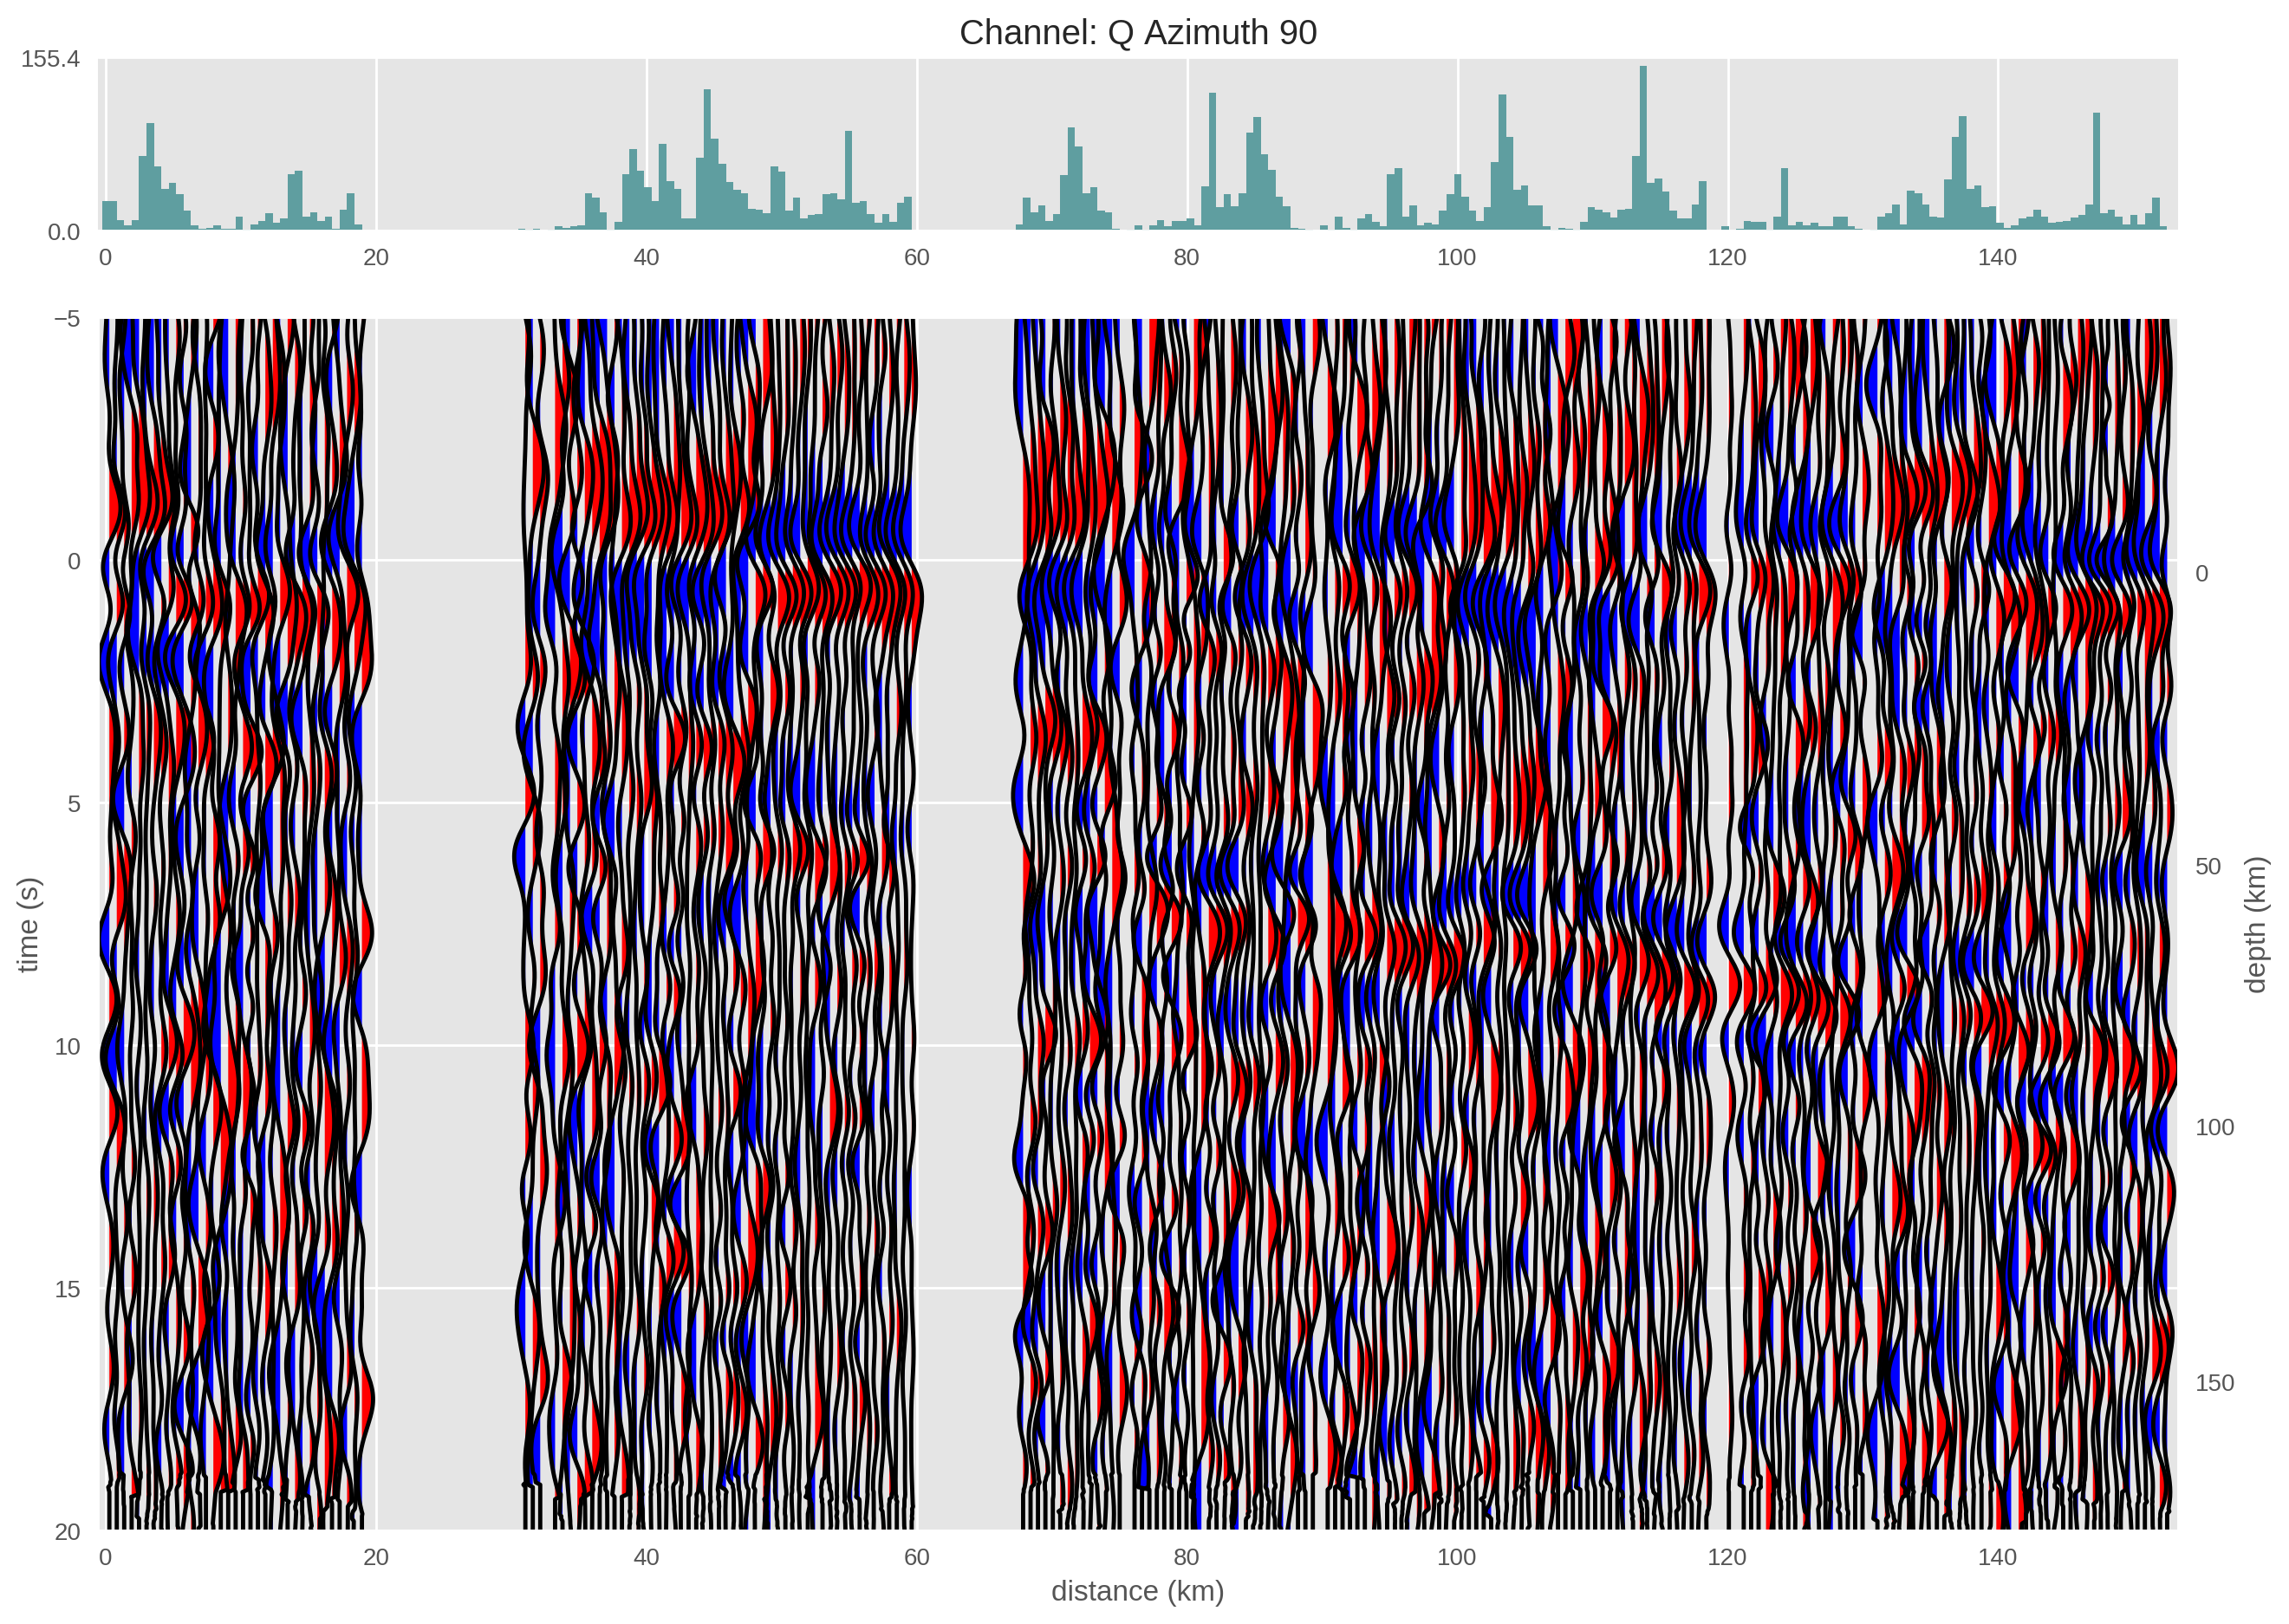
We explore the Rayleigh wave phase velocity anomalies beneath the Gujarat, a westernmost province in India, in a broad period range of \( 20-200s \). Rayleigh wave dispersion curves are measured using the two-station approach and incorporating the broadband waveforms at 30 seismic stations from 1462 global earthquakes. We obtained 287 inter-station dispersion curves that are inverted for high resolution isotropic and azimuthally anisotropic phase velocity maps independently at each period. The shorter periods (20-40s) results coincide well with the known geological features - the thick sedimentary layers of Kachchh exhibits low-velocity anomaly while the reduced crustal thickness of Saurashtra Horst and Mainland Gujarat reflects relatively high-velocity anomalies. The three major rift zones of the region, consisting of thick sedimentary deposition, are revealed by the low-velocity anomalies at shorter periods (20-40s). The persistent low-velocity anomalies beneath the Kachchh zone at longer periods may be an indication of asthenospheric flow. Azimuthal anisotropy at longer periods \( (> 70s) \) shows fast polarization directions broadly similar to the northward drift of the Indian plate towards the Eurasian plate. At shorter periods, the fast polarization direction has mostly east-west trend which correlates well with the E-W oriented rift faults of seismically most active Kachchh region.
What Causes the Common‐Mode Error in Array GPS Displacement Fields: Case Study for Taiwan in Relation to Atmospheric Mass Loading [Published]
We analyze 47 best‐quality, 10‐year‐long daily Global Positioning System (GPS) position time series of Taiwan, to understand the origin of the GPS’s common‐mode error (CME) whose seasonality in the standard deviation evidences a meteorological origin. We employ the empirical orthogonal function analysis to efficiently extract the CME as the leading island‐wide mode for all three components (whereas the second mode relates to the El Niño Southern Oscillation). We find that the CME correlates well with the acquired variations in the atmospheric mass loading (AML) displacement field for Taiwan courtesy of NASA Goddard Space Flight Center for the vertical component with high coherence around 11–14 cycles per year. Further regression analysis shows that the maximum 90% of the non‐seasonal AML displacements in Taiwan are evident in the CME variations.
Precipitation and cloud structure variations between two southern Indian states [Published]
Raindrop size distribution (RSD) characteristic variations between two southern Indian stations [Gadanki \( (13.5^{\circ} N, 79.2^{\circ} E) \) Kadapa \( (14.47^{\circ} N, 78.82^{\circ} E) \)] using ground based parsivel disdrometer data are studied. Number concentration of mid and large drops is more over Gadanki when compared to Kadapa precipitation. The mean value of mass weighted mean diameter (Dm) is higher in Gadanki than Kadapa precipitation. Both monthly and diurnal variations of Dm show higher values of Dm over Gadanki than Kadapa. After classifying the precipitations systems into stratiform and convective, Gadanki has higher (lower) Dm than Kadapa in stratiform (convective).
Understanding of Taiwan typhoon rainfall erosivity using raindrop size distribution [Published]
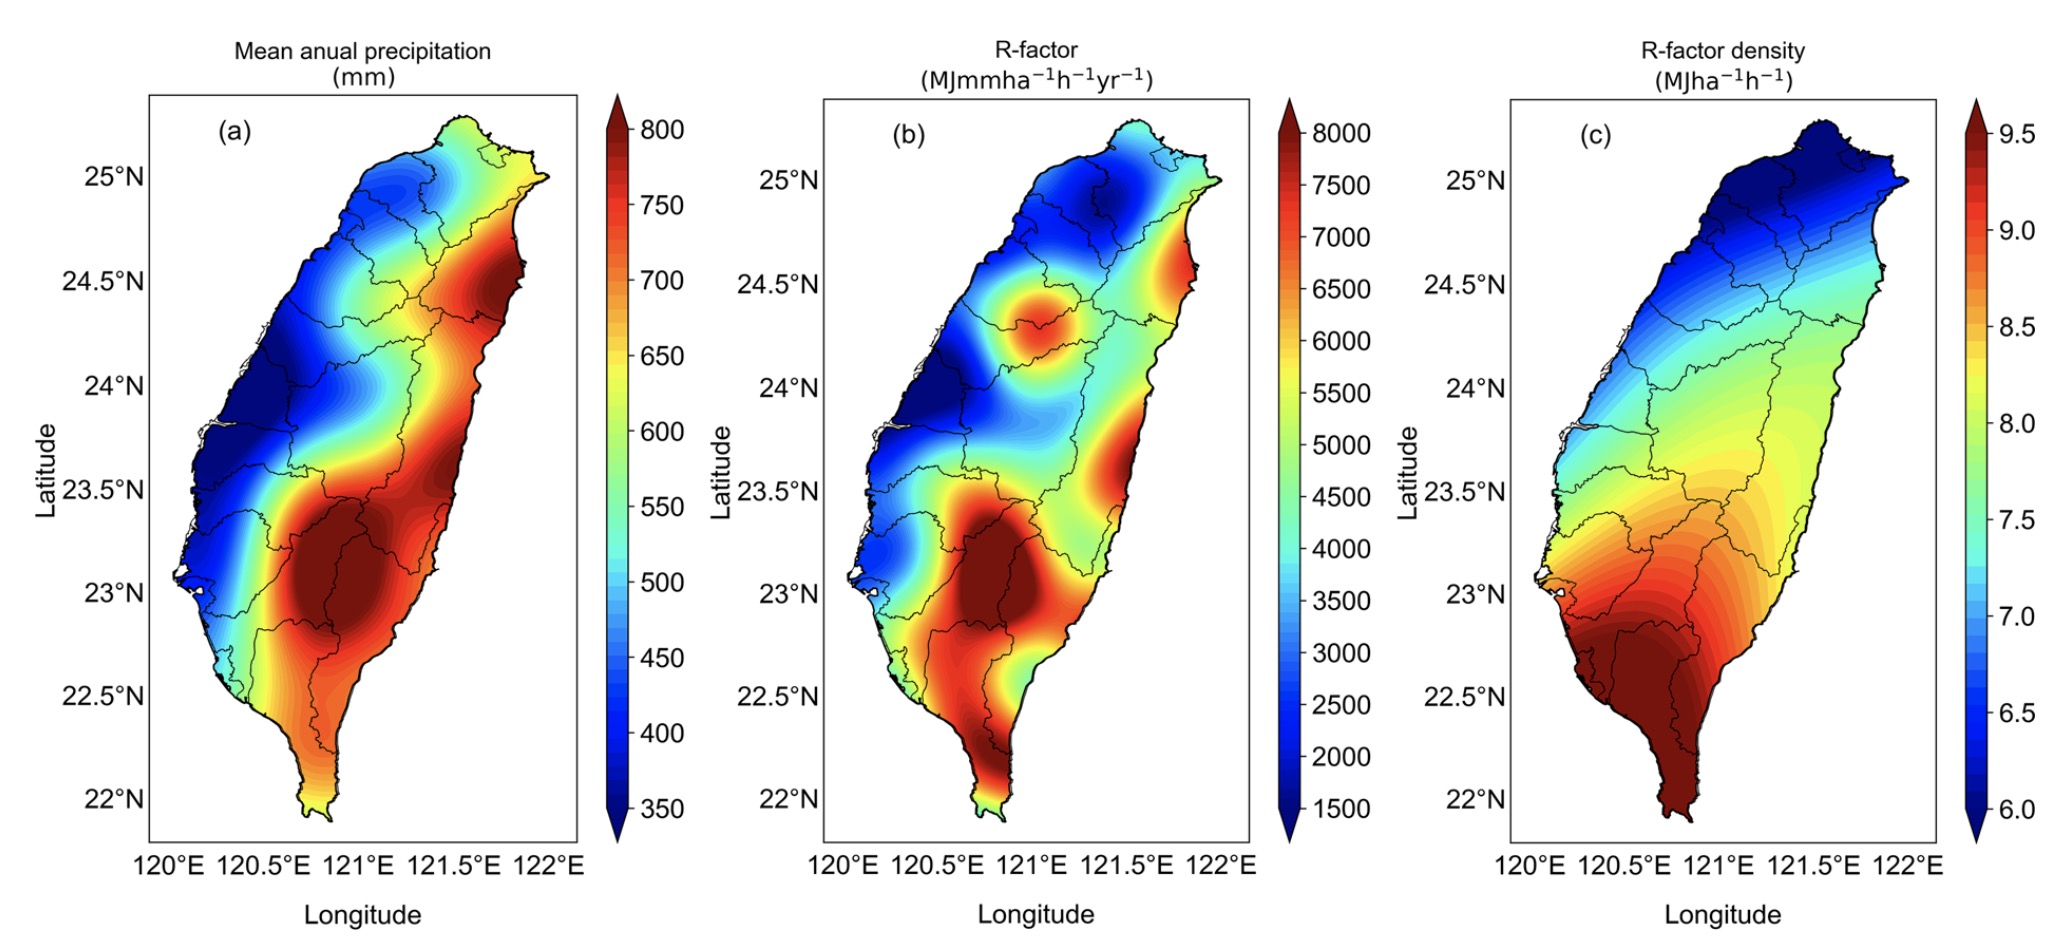
Rainfall erosion has severe implication on agriculture, water, and land use management. Though there were rainfall erosion studies on regional/global scale, tropical cyclones’ rainfall erosion is poorly assessed and have been not documented for some of the most cyclones affecting regions of the world like Taiwan. Here, using 15-years of raindrop size distributions and 60-years of hourly rain gauge data, we estimated cyclones’ (also called typhoons) rainfall erosivity over Taiwan, and establish that typhoons’ mean rainfall erosivity is higher than the global mean rainfall erosivity. Moreover, regional variability of typhoons rainfall erosivity showed an increasing pattern from north to south, with relatively higher values over the eastern and southern part of Taiwan.
STADIUM-Py: A Python-based automated software package for receiver function and shear-wave splitting analyses [Under Development]
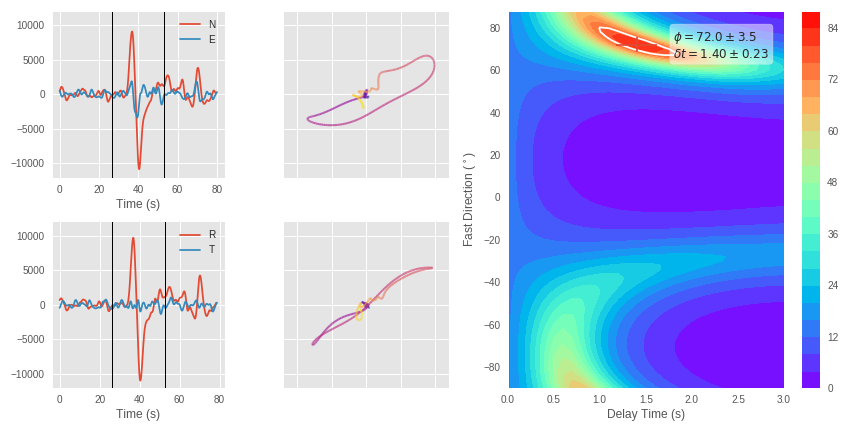
DETAILS COMING SOON!
Official Web Page for STADIUMpy: http://www.earthinversion.com/stadiumpy/
ONGOING STUDY
Fully-automated Focal Mechanism Determination System and it’s Application on the Events Located in Northern Philippines
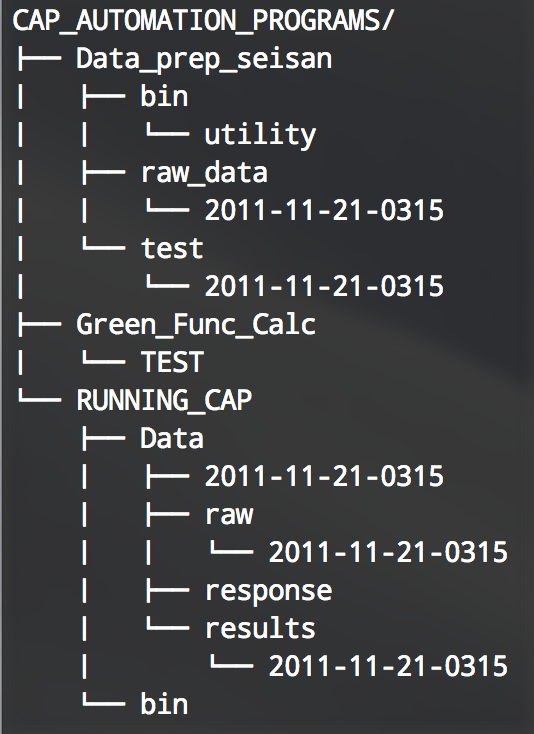
Principal constraints on the source retrieval from the regional seismograms is the non-linearity of the course of steps, time-involved in estimating the stable and reliable solution. We have developed a fully-automated set of programs that can invert for the highly stable source-mechanism of an event using the given set of seismograms. In this study, we adopted the stable and reliable “cut-and-paste” source estimation technique (Zhao and Helmberger, 1994). We have modified and some programs to the original set of programs written by Lupei Zhu, to make it user-friendly. Our set of programs also includes the adaptive data preparation category, in addition to the green function calculation and the inversion of the seismograms. The additional programs have been currently written in Bash and Perl. We aim to re-write it in Python and also create graphical user interface (GUI) which can be run easily in Windows and Mac environment. We apply our programs for obtaining the focal mechanism and stress inversion in the northern Philippines.
A Study Guide for Theoretical Global Seismology by Dahlen and Tromp (1998)
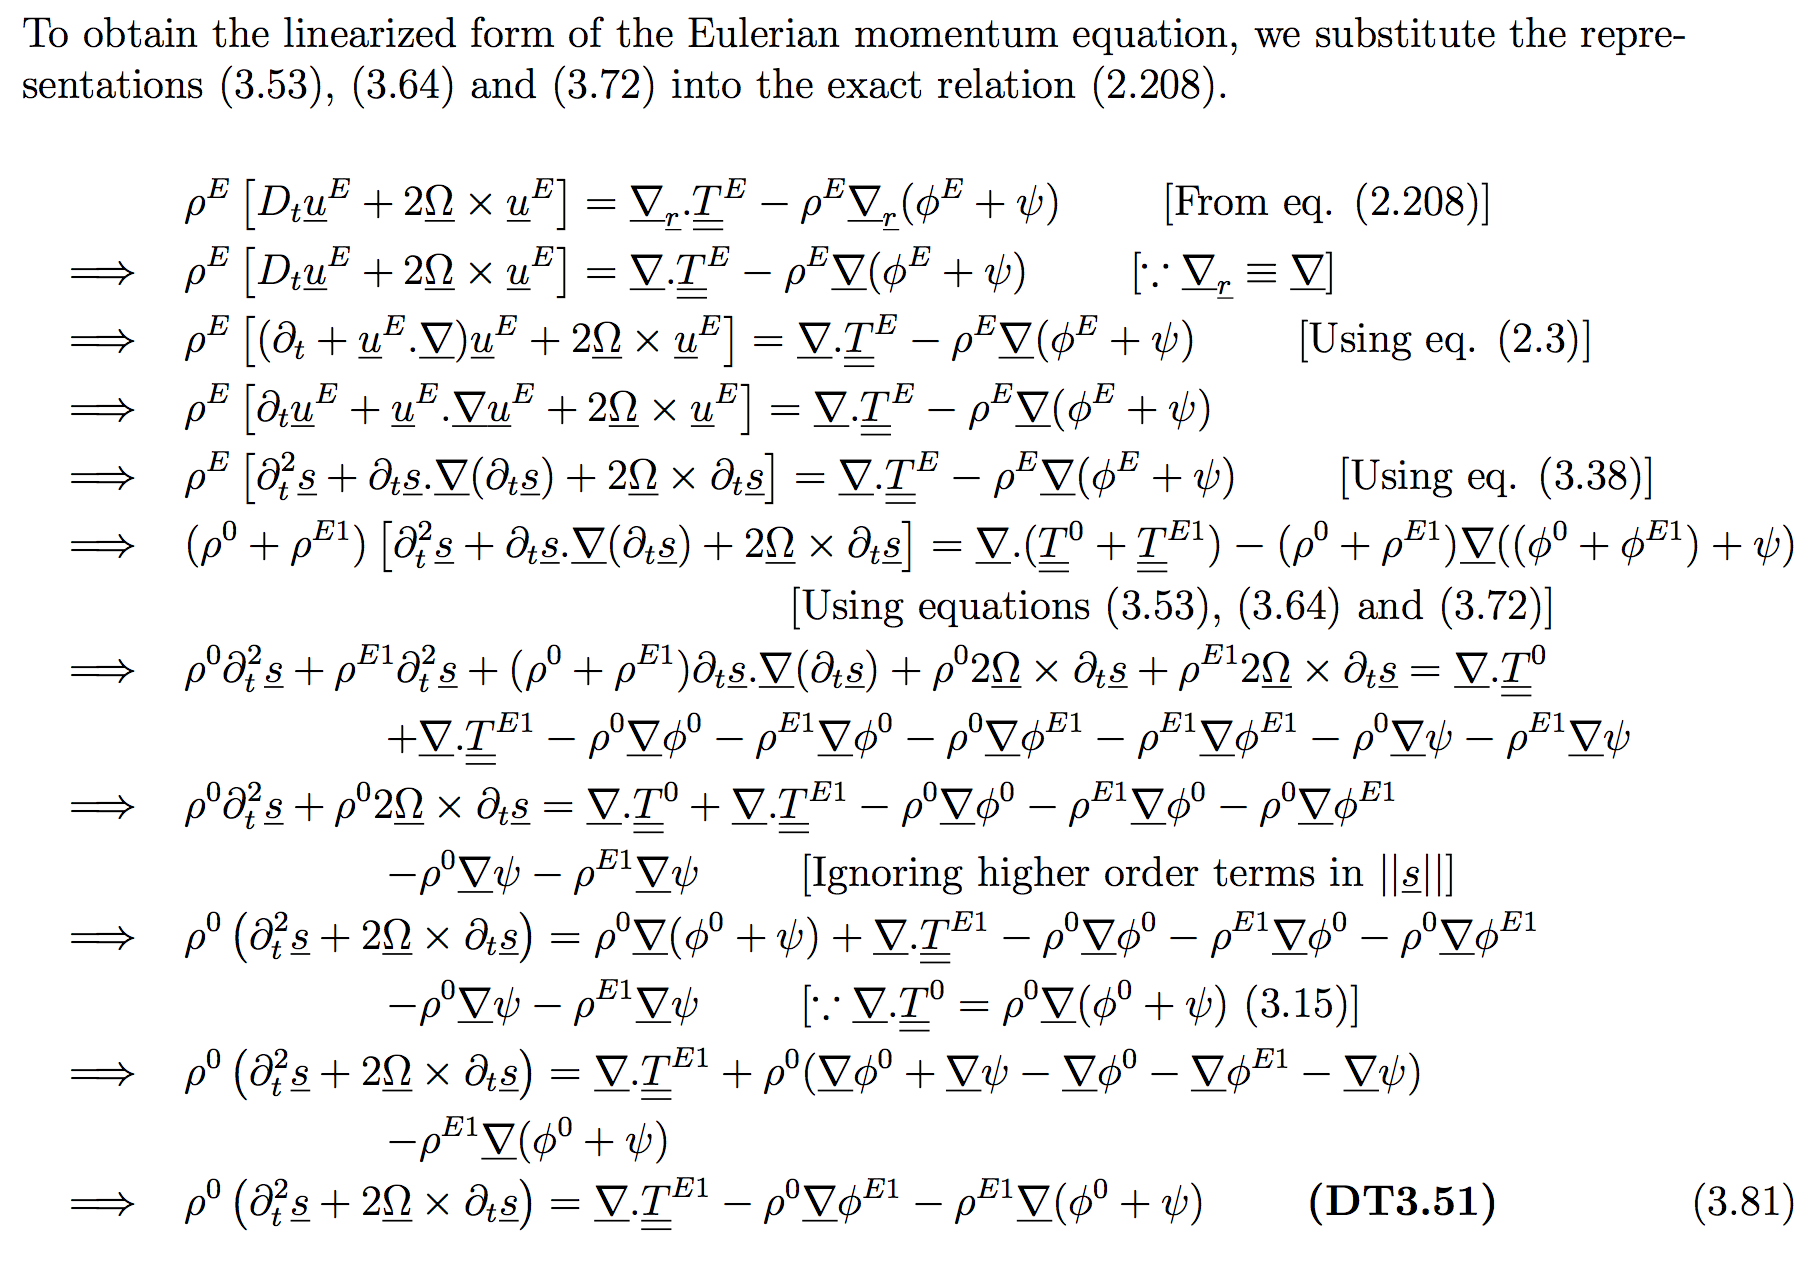
Theoretical Global Seismology by Dahlen and Tromp presents an advanced theoretical treatment of global seismology, describing the normal-mode, body-wave, and surface wave methods employed in the determination of the Earth’s three-dimensional internal structure and the source-mechanisms of earthquakes. The book consists of thousands of equations in a very concise form and without a proper understanding of these equations, the readers will be short of grabbing its real purpose. We endeavor to prepare a comprehensive study guide consisting of all the details of the book and the stepwise derivation of all the equations. This will be approachable for the undergraduate students and other readers from different fields referring to this book.

Analysis of Anomalously Large Co-seismic Deformation in the 2016 ML6.6 Meinong, Taiwan, Earthquake using EOF method on dense continuous GPS data of Taiwan
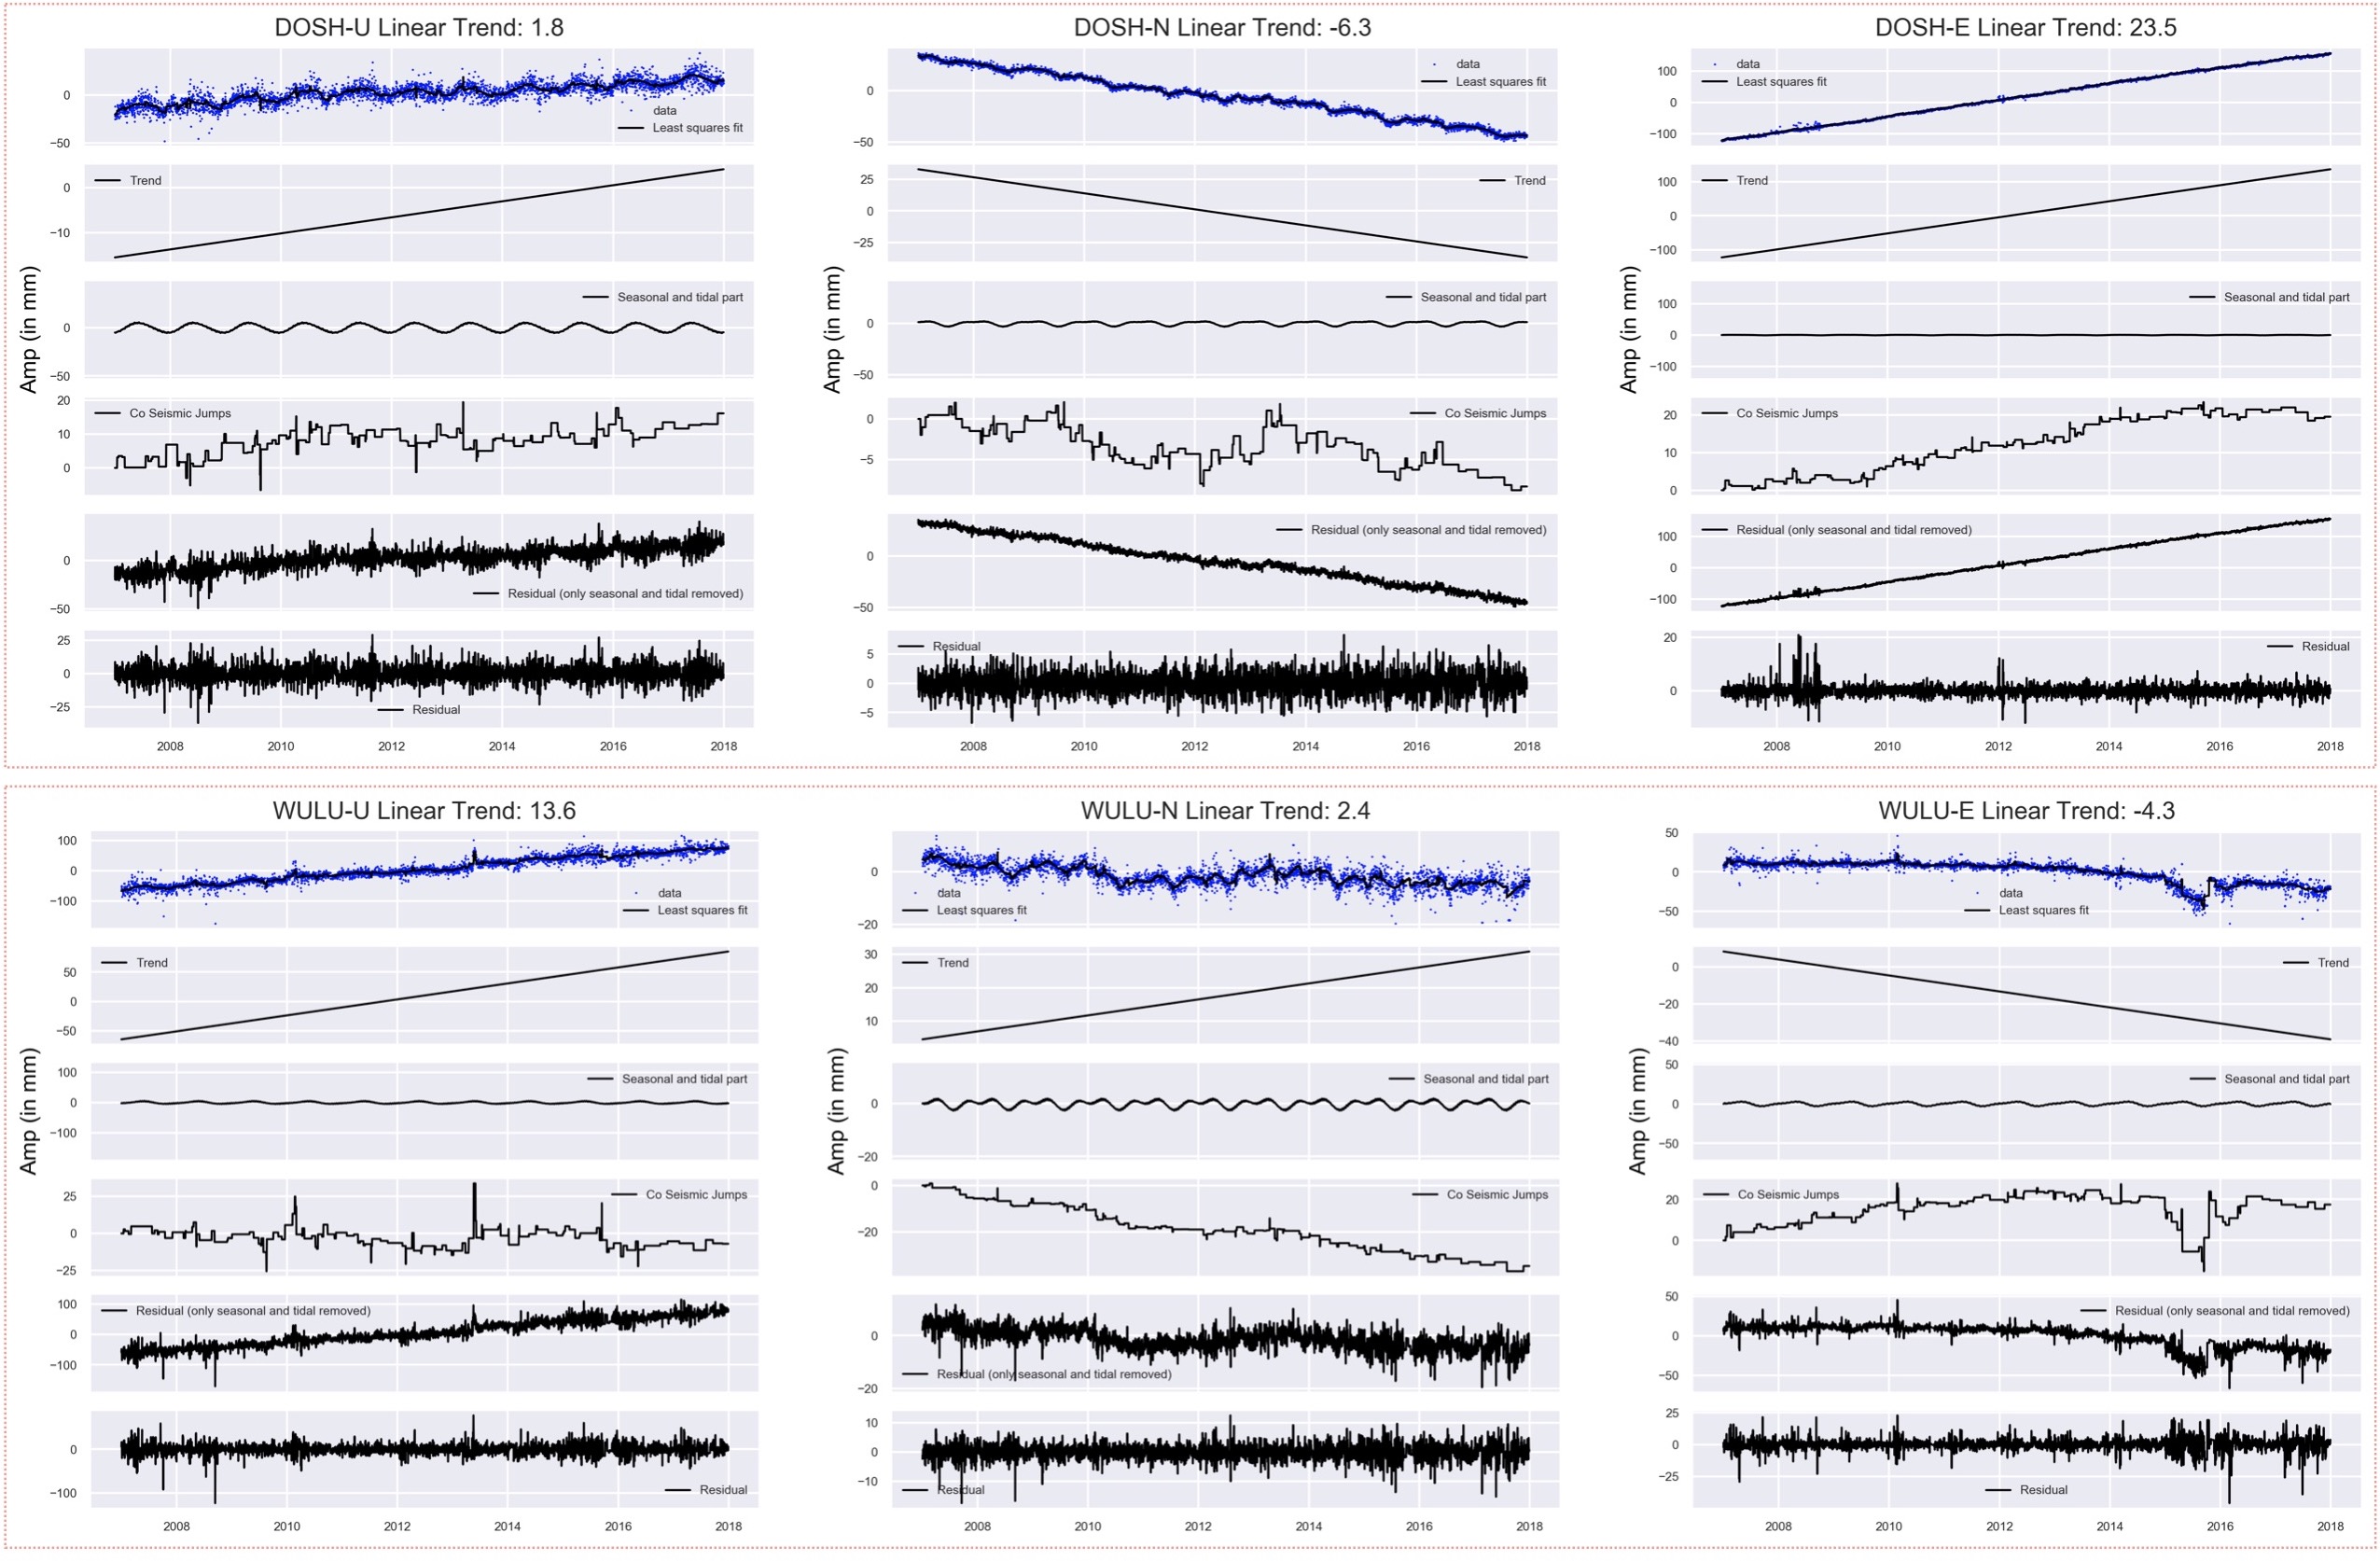
Taking advantage of the dense continuous GPS network data, we demonstrate the effective utility of the method of empirical orthogonal function (EOF) in obtaining the coseismic deformation (vector) field on the crustal surface caused by anomalously large displacement caused by the Meinong Earthquake. The EOF analysis is capable of extracting the coseismic deformation in the form of coherent spatial pattern and time evolution. The extracted coseismic spatial patterns provide evidences linking the regional tectonics with the orogenic process in Taiwan under the plate convergence.
Crustal fluid and afterslip drive transient postseismic deformation associated with the 2016 Meinong earthquake (Mw 6.4)
The 2016 Meinong earthquake (Mw 6.4) occurred in the southern Taiwan, and caused heavy causalities and one building collapse in Tainan city. Here we employ the empirical orthogonal function (EOF) to capture the coherent spatio-temporal features of surface deformation associated with this event in the continuous GPS (cGPS) time series. The solved EOF modes feature the dominant coseismic offsets for three components which are constant with the forward modelling using the seismic dislocation theory, and a significant transient postseismic deformation, which mainly reflect in the E component. There is no clear pre-seismic deformation rate change in the cGPS time series through the Monte-Carlo simulation and statistical test based on the time series of mode 1. The effect of the poro-elastic rebound,viscoelastic relaxation of the upper mantle, and the after-slip is combined to explain the observed postseismic deformation. Results show that the viscoelastic relaxation plays a negligible role in the postseismic deformation. Such transient postseismic deformation is dominated by the poro-elastic rebound and possible after-slip, which only lasts few months.
Anomalous GPS crustal motions along Taiwan’s east coast: EOF analysis
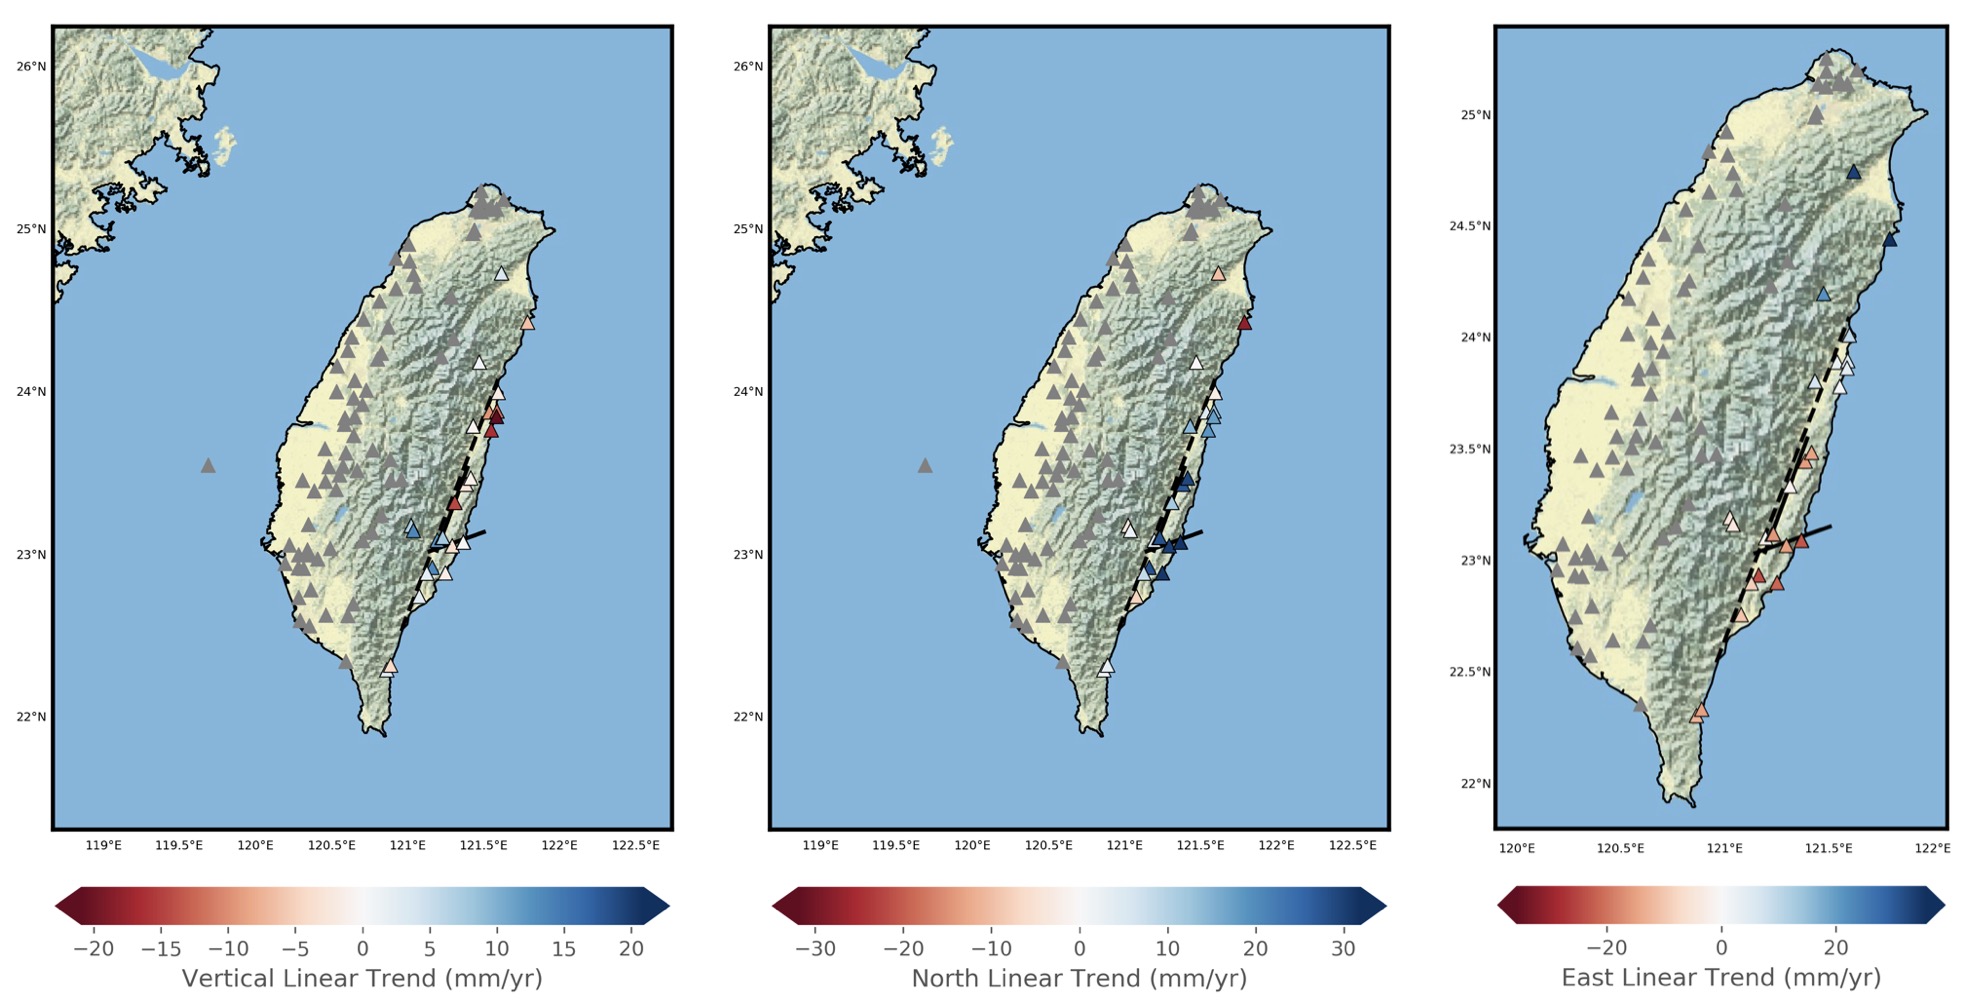
The island of Taiwan is subject to active orogeny and associated seismicity as effects of the complex collision between the Philippine Sea Plate and the Eurasian Plate. Rapid anomalous elevation changes were detected in the Longitudinal Valley along the Eastern coast of Taiwan using tide-gauge/altimetry and GPS observations in the past. Here we apply the method of empirical orthogonal function (EOF) to the continuous GPS network data for 13 years (2005-2018). EOF extracts the coherent signals of the GPS deformation field apart from the seasonal and the common-mode error signals; the purpose is to inspect and understand the spatio-temporal tectonic motions of the Eastern coast during the period. We also try the complex EOF to search for any dynamical internal structure that may undergo propagation or wave-like pattern in the GPS deformation field along the coast.
OTHER NOTABLE PROJECTS
Masters Thesis: Surface Wave Group Velocity Dispersion study of the Eastern Himalayan Foreland Basin
Seismic surface waves, recorded at regional distances, sample the 1-Dimensional structure between the earthquake source and receiver. Dispersed surface waves are sensitive to the vertical average of shear wave velocities in a layered medium. Using both these properties, we model the crust and upper mantle shear wave velocity structure of the eastern Himalayan foreland basin by modeling multi-mode surface wave group velocity dispersion data. We use earthquakes originating in Sikkim-Bhutan Himalaya and the Bengal basin recorded at the permanent broadband seismological observatory at Bakreshwar (BAKR). Source-receiver raypaths sample the foreland basin adjacent to the Sikkim-Bhutan Himalaya and the Bengal Basin. We measure Rayleigh and Love waves dispersion for both fundamental and the first higher mode, in the frequency-time domain, using the multiple filter analysis (MFA) technique. Observed dispersion curves are clustered into 2 groups based on the raypath sampled. Rayleigh and Love wave dispersion data for Cluster 1 ranges from 6 to 30 s and 5 to 19 s, respectively, for the fundamental mode. Similarly, the fundamental mode Rayleigh wave dispersion data for Cluster 2 ranges from 9 to 36 s. Clustered multi-mode dispersion data has been jointly inverted to model the crust and upper mantle structure beneath the sampled regions. The Eastern foreland basin has 4 km thick sedimentary layer as compared to approximately 7 km thick sedimentary layer of Western and Central Foreland Basin. The crustal thickness of Bengal Basin, which is overlain by 18 km thick sediments / sedimentary rocks, is just 20 km. This shows that it is a continental margin crust which has been overlain by the sediments brought down by the rivers like Ganga and Brahmaputra from the orogeny.
Disclaimer of liability
The information provided by the Earth Inversion is made available for educational purposes only.
Whilst we endeavor to keep the information up-to-date and correct. Earth Inversion makes no representations or warranties of any kind, express or implied about the completeness, accuracy, reliability, suitability or availability with respect to the website or the information, products, services or related graphics content on the website for any purpose.
UNDER NO CIRCUMSTANCE SHALL WE HAVE ANY LIABILITY TO YOU FOR ANY LOSS OR DAMAGE OF ANY KIND INCURRED AS A RESULT OF THE USE OF THE SITE OR RELIANCE ON ANY INFORMATION PROVIDED ON THE SITE. ANY RELIANCE YOU PLACED ON SUCH MATERIAL IS THEREFORE STRICTLY AT YOUR OWN RISK.

