Autoencoders for Seismic Waveforms: Compress, Learn, and Generate
Autoencoders learn compact representations by reconstructing seismic data. This tutorial explains their use...

Magnitude 2.5+ over the past 24 hours.
Loading recent earthquakes…
Autoencoders learn compact representations by reconstructing seismic data. This tutorial explains their use...

A compact macOS setup with two Alfred workflows for turning caffeinate on and off, plus SwiftBar for keepin...
Recent technical articles on seismic analytics, scientific computing, numerical modeling, and production data workflows.
An unexpected drop in a building’s natural frequency is the structure reporting that it has lost stiffness — usually the first sign of damage. Here is why to...
Foundation models ask whether one pretrained representation of seismic waveforms can support picking, detection, classification, and other downstream tasks—w...
Load a waveform with ObsPy, run a pre-trained PhaseNet (or EQTransformer) model from SeisBench, and plot the picked P and S arrivals — a hands-on bridge from...
An intuitive guide to MCMC: a walker in the fog whose footprints map the posterior. We build a Metropolis sampler from scratch, check it against an exact ana...
How NonLinLoc locates earthquakes by mapping a full probability density over the search volume instead of iterating to a single point — the Bayesian idea, th...
A tour of how modern earthquake-monitoring systems turn continuous seismic waveforms into earthquake catalogs — the ML pipeline of picking, association, and ...
A beginner-friendly walkthrough to build and run Whisper Journal with multilingual dictation, local Whisper transcription, AI-assisted title/tag generation, ...
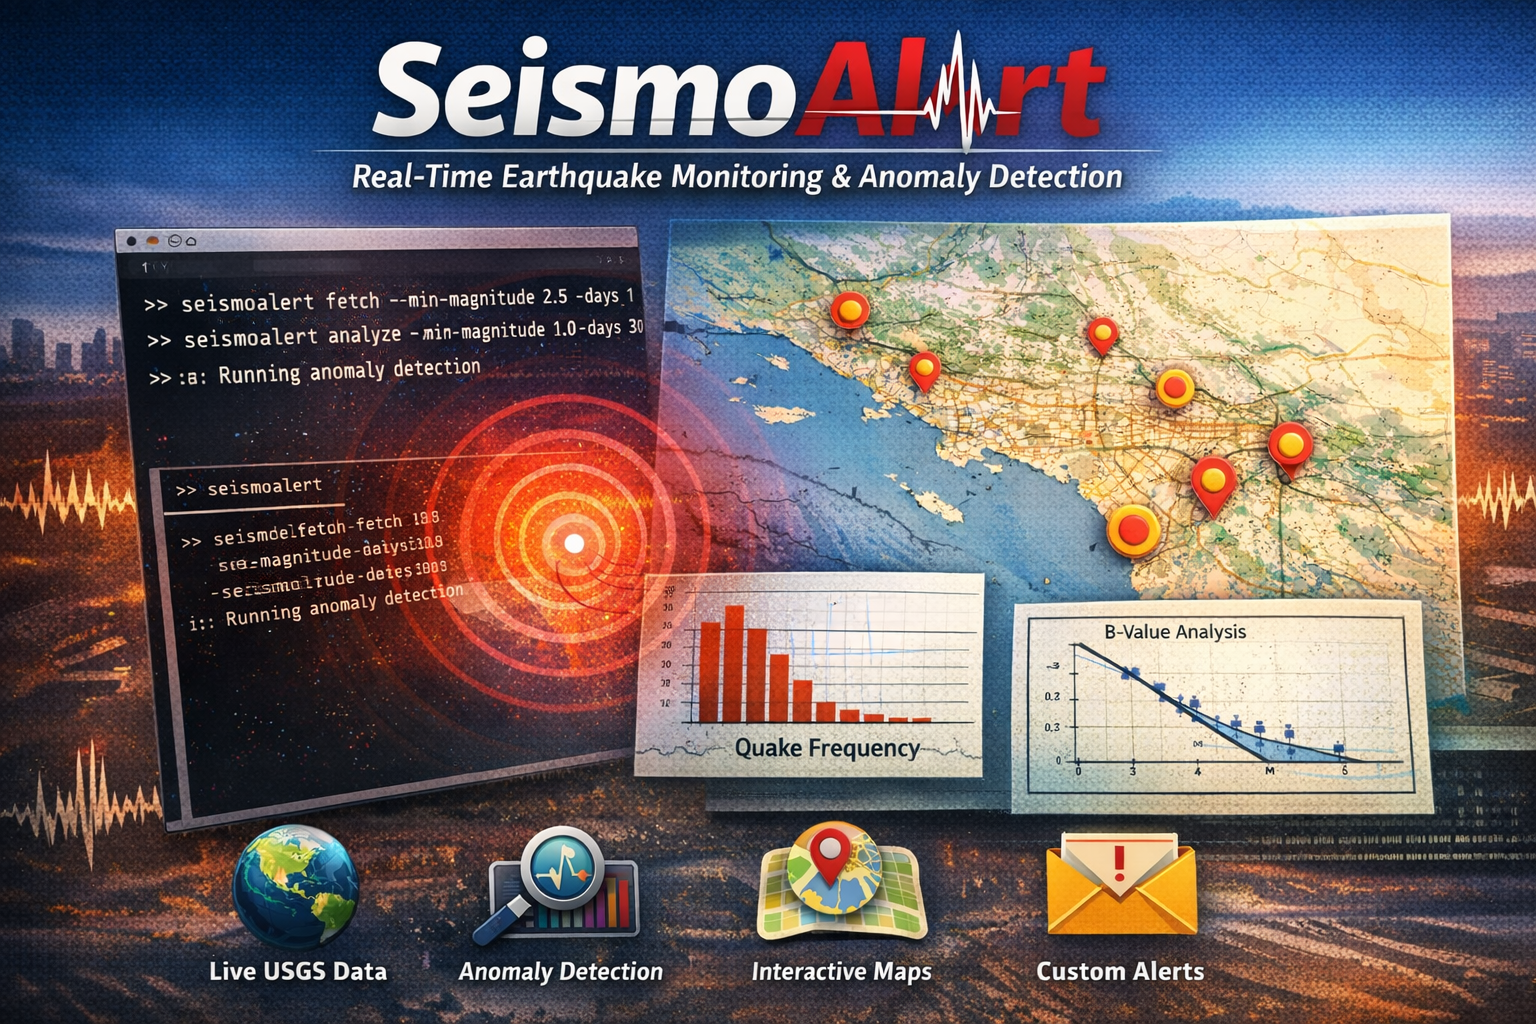
I built SeismoAlert to fetch USGS earthquake data, run statistical analysis, detect anomalies, and generate interactive maps from a single CLI.
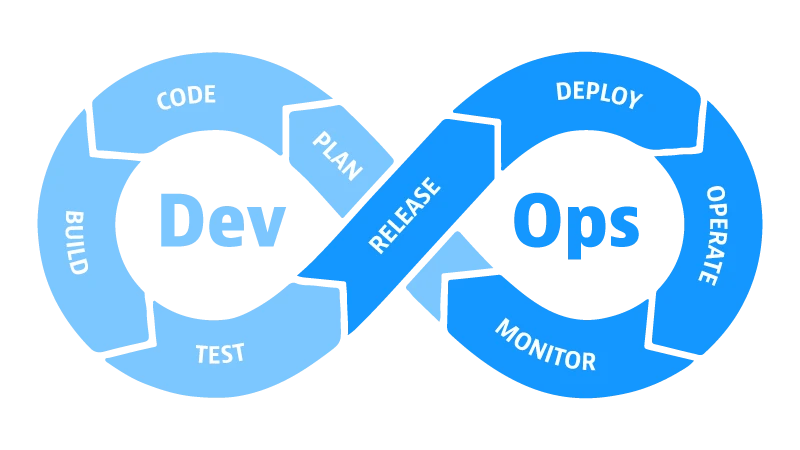
A practical, beginner-friendly walkthrough of a complete FastAPI DevOps workflow: clean code, layered testing, CI with Jenkins and GitHub Actions, and runtim...
Turn your everyday computer into a home server you can access from anywhere using Dynamic DNS, a simple update script, and secure SSH access.
The San Francisco Bay Area combines high seismic hazard, dense urban exposure, and aging infrastructure. Structural Health Monitoring can improve post-earthq...
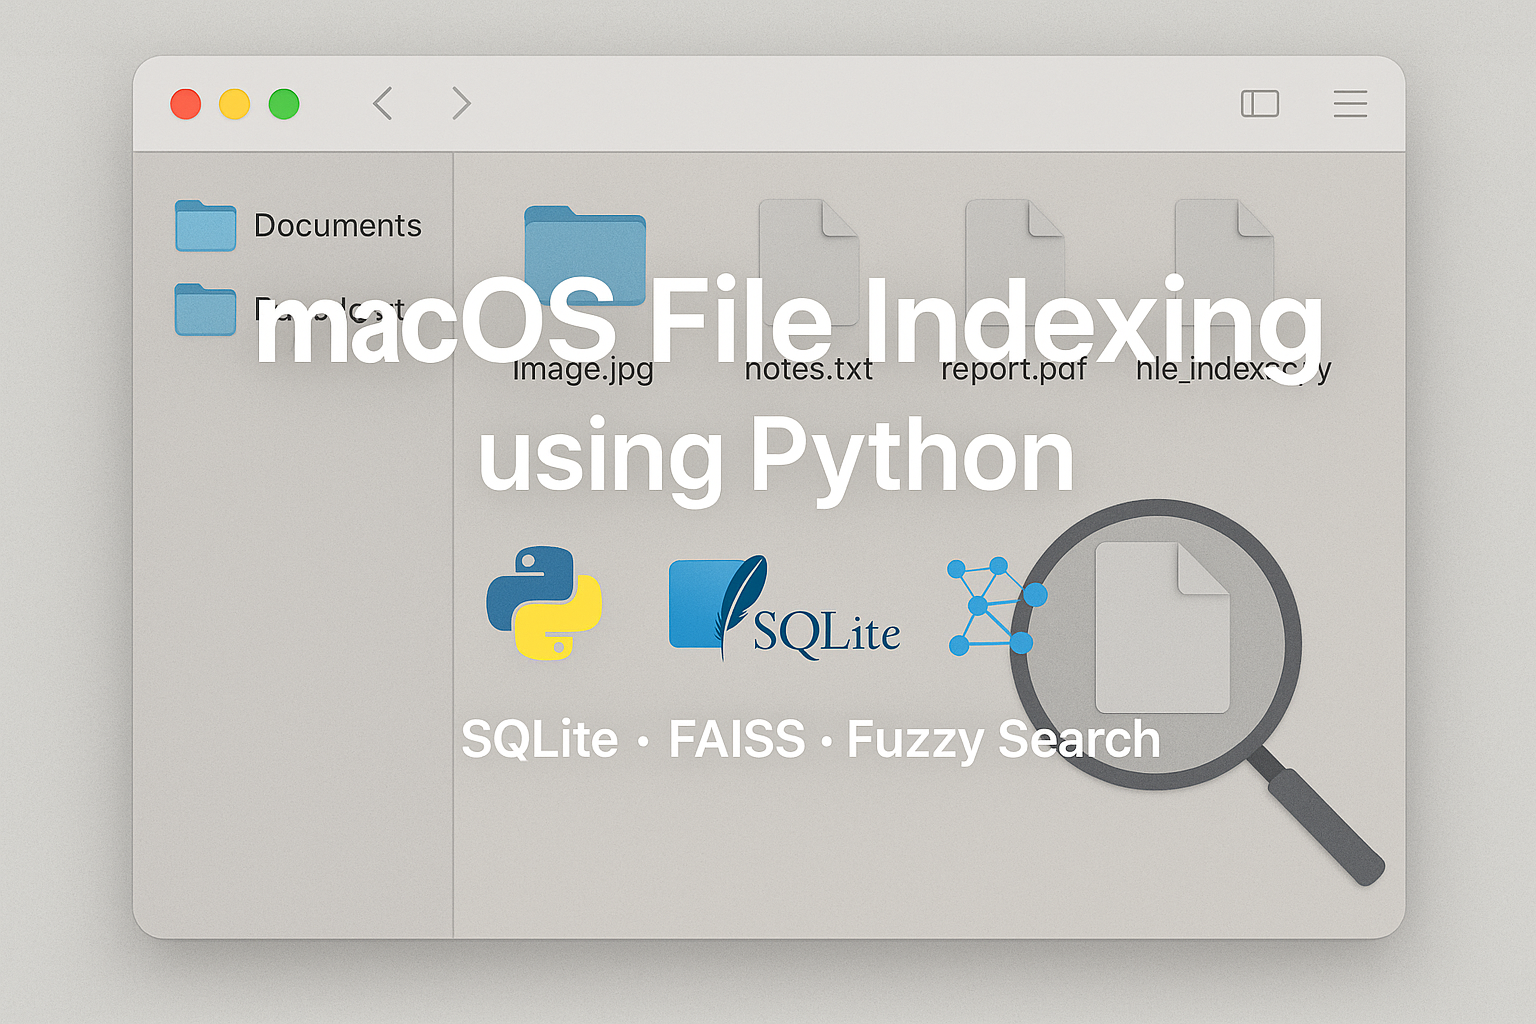
A Python-based solution for indexing and searching files on a macOS system using SQLite, FAISS, and semantic search.
An unexpected drop in a building’s natural frequency is the structure reporting that it has lost stiffness — usually the first sign of damage. Here is why to...
Foundation models ask whether one pretrained representation of seismic waveforms can support picking, detection, classification, and other downstream tasks—w...
Load a waveform with ObsPy, run a pre-trained PhaseNet (or EQTransformer) model from SeisBench, and plot the picked P and S arrivals — a hands-on bridge from...
An intuitive guide to MCMC: a walker in the fog whose footprints map the posterior. We build a Metropolis sampler from scratch, check it against an exact ana...
How NonLinLoc locates earthquakes by mapping a full probability density over the search volume instead of iterating to a single point — the Bayesian idea, th...
A tour of how modern earthquake-monitoring systems turn continuous seismic waveforms into earthquake catalogs — the ML pipeline of picking, association, and ...
A beginner-friendly walkthrough to build and run Whisper Journal with multilingual dictation, local Whisper transcription, AI-assisted title/tag generation, ...
I built SeismoAlert to fetch USGS earthquake data, run statistical analysis, detect anomalies, and generate interactive maps from a single CLI.
A practical, beginner-friendly walkthrough of a complete FastAPI DevOps workflow: clean code, layered testing, CI with Jenkins and GitHub Actions, and runtim...
Turn your everyday computer into a home server you can access from anywhere using Dynamic DNS, a simple update script, and secure SSH access.
The San Francisco Bay Area combines high seismic hazard, dense urban exposure, and aging infrastructure. Structural Health Monitoring can improve post-earthq...
A Python-based solution for indexing and searching files on a macOS system using SQLite, FAISS, and semantic search.