Three-dimensional perspective map of Taiwan using GMT and PyGMT (codes included)
We learn how to make the three-dimensional map using both GMT and PyGMT. Python lovers may choose to use the PyGMT version and others might prefer the GMT version, but both versions are necessarily using the same core library. PyGMT is simply the Python wrapper of GMT. However, since it is coded in Python, it can be quite flexible for several applications.
Key idea — grdview drapes the relief as a surface, and perspective is just two viewing angles. A flat map is grdimage; a 3-D view is grdview, which turns the elevation grid into a raised surface with a real z-axis. What makes it look “3-D” is the perspective — set by an azimuth (which compass direction you’re viewing from, 0–360°) and an elevation (how high above the horizon your eye sits, 0–90°). In GMT that’s -p150/25; in PyGMT it’s perspective=[150, 30]. Same core library, two front-ends.
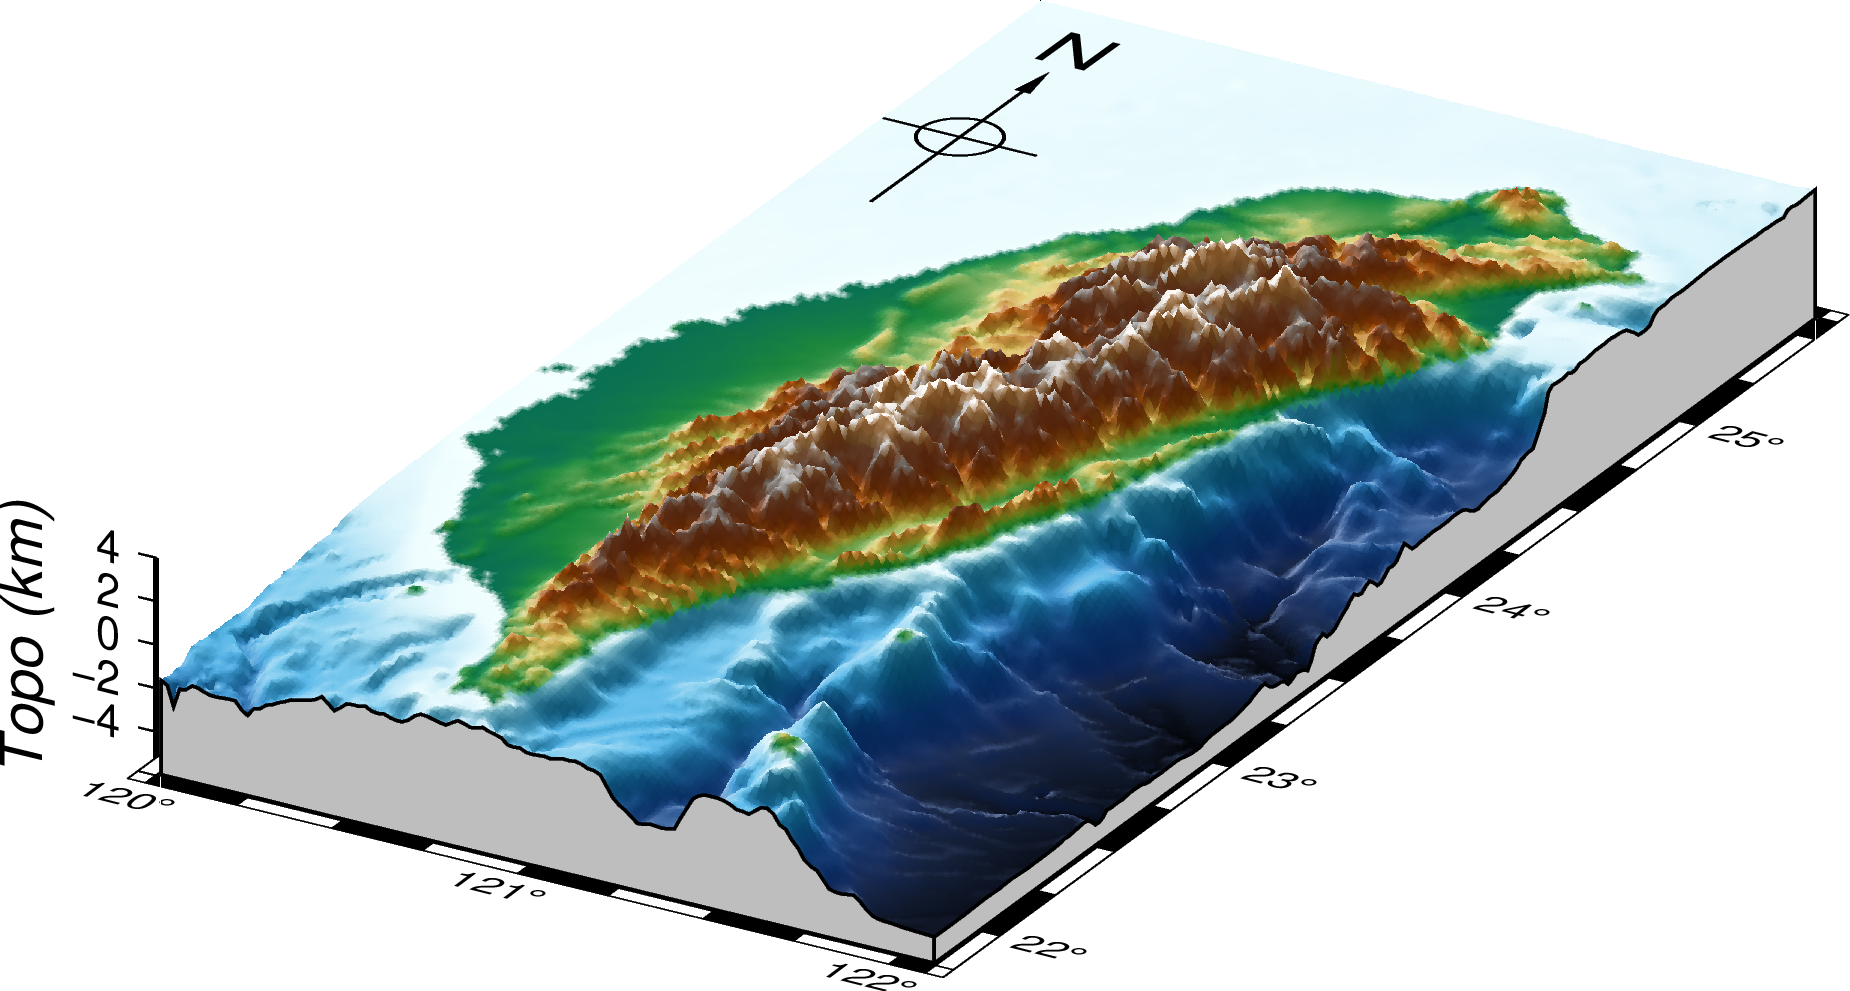
Using GMT to plot the 3-D perspective map of Taiwan
#!/usr/bin/bash

minlon=120
maxlon=122.1

minlat=21.8
maxlat=25.6

gmt begin taiwan png
    gmt basemap -R${minlon}/${maxlon}/${minlat}/${maxlat}/-6/4 -JM3i -JZ0.8i -p150/25 -B -Bz2+l"Topo (km)" -BSEwnZ
    gmt grdview @earth_relief_01m -R${minlon}/${maxlon}/${minlat}/${maxlat}/-6000/4000 -p -C -I+d -N-6000+ggray -Qi500 -Wthin
    gmt basemap -p -TdjTL+w3c+l+o-2c/-1c
gmt end
The script is very straightforward. We first define the map coordinates, the used the GMT6 interface to plot it.
We first start with the basemap and define the region and the vertical range of the map. Here, we call the range of the vertical axis from -6 to 4 units. We used the Mercator projection (-JM) and scale the vertical axis to be 0.8i and the perspective is set to 150 degrees of azimuth and 25 degrees of elevation (-p150/25). We label the vertical axis every 2 units - -Bz2. Note that GMT6 can automatically retrieve topographic data if it is not locally available, and if we give the data path as @earth_relief_01m.
Using PyGMT to plot the 3-D perspective map of Taiwan
import pygmt

minlon, maxlon = 120., 122.1
minlat, maxlat = 21.8, 25.6

# Load sample earth relief data
grid = pygmt.datasets.load_earth_relief(resolution="03s", region=[minlon, maxlon, minlat, maxlat])

frame =  ["xa1f0.25","ya1f0.25", "z2000+lmeters", "wSEnZ"]

pygmt.makecpt(
        cmap='geo',
        series=f'-6000/4000/100',
        continuous=True
    )
fig = pygmt.Figure()
fig.grdview(
    grid=grid,
    region=[minlon, maxlon, minlat, maxlat, -6000, 4000],
    perspective=[150, 30],
    frame=frame,
    projection="M15c",
    zsize="4c",
    surftype="i",
    plane="-6000+gazure",
    shading=0,
    # Set the contour pen thickness to "1p"
    contourpen="1p",
)
fig.basemap(
    perspective=True,
    rose="jTL+w3c+l+o-2c/-1c" #map directional rose at the top left corner
)

fig.colorbar(perspective=True, frame=["a2000", "x+l'Elevation in (m)'", "y+lm"])
fig.savefig("topo-plot_3d.png", crop=True, dpi=300)
This plot is almost the same as before but with slight modifications. The first thing to notice is the topographic data resolution (3s data used). We also clip the standard geo colormap to the range of -6000 to 4000 meters. The perspective, in this case, is 150 degrees azimuth and 30 degrees of elevation. The azimuth ranges from -180 to 180 degrees and elevation from 0 to 90 degrees. We set the shading to 0 (ranges from -1 to 1). As in the GMT case, we plot the map directional rose at the top left corner.
One PyGMT argument was renamed. In the fig.grdview(...) call above, contourpen="1p" is now contour_pen="1p" on current PyGMT (the old name was deprecated and later removed; likewise meshpen → mesh_pen, facadepen → facade_pen). Swap the name if you hit a deprecation warning or TypeError — the behavior is unchanged. The raw GMT script and everything else run as-is.
Quick check: In perspective=[150, 30] (and GMT’s -p150/25), what do the two numbers control?
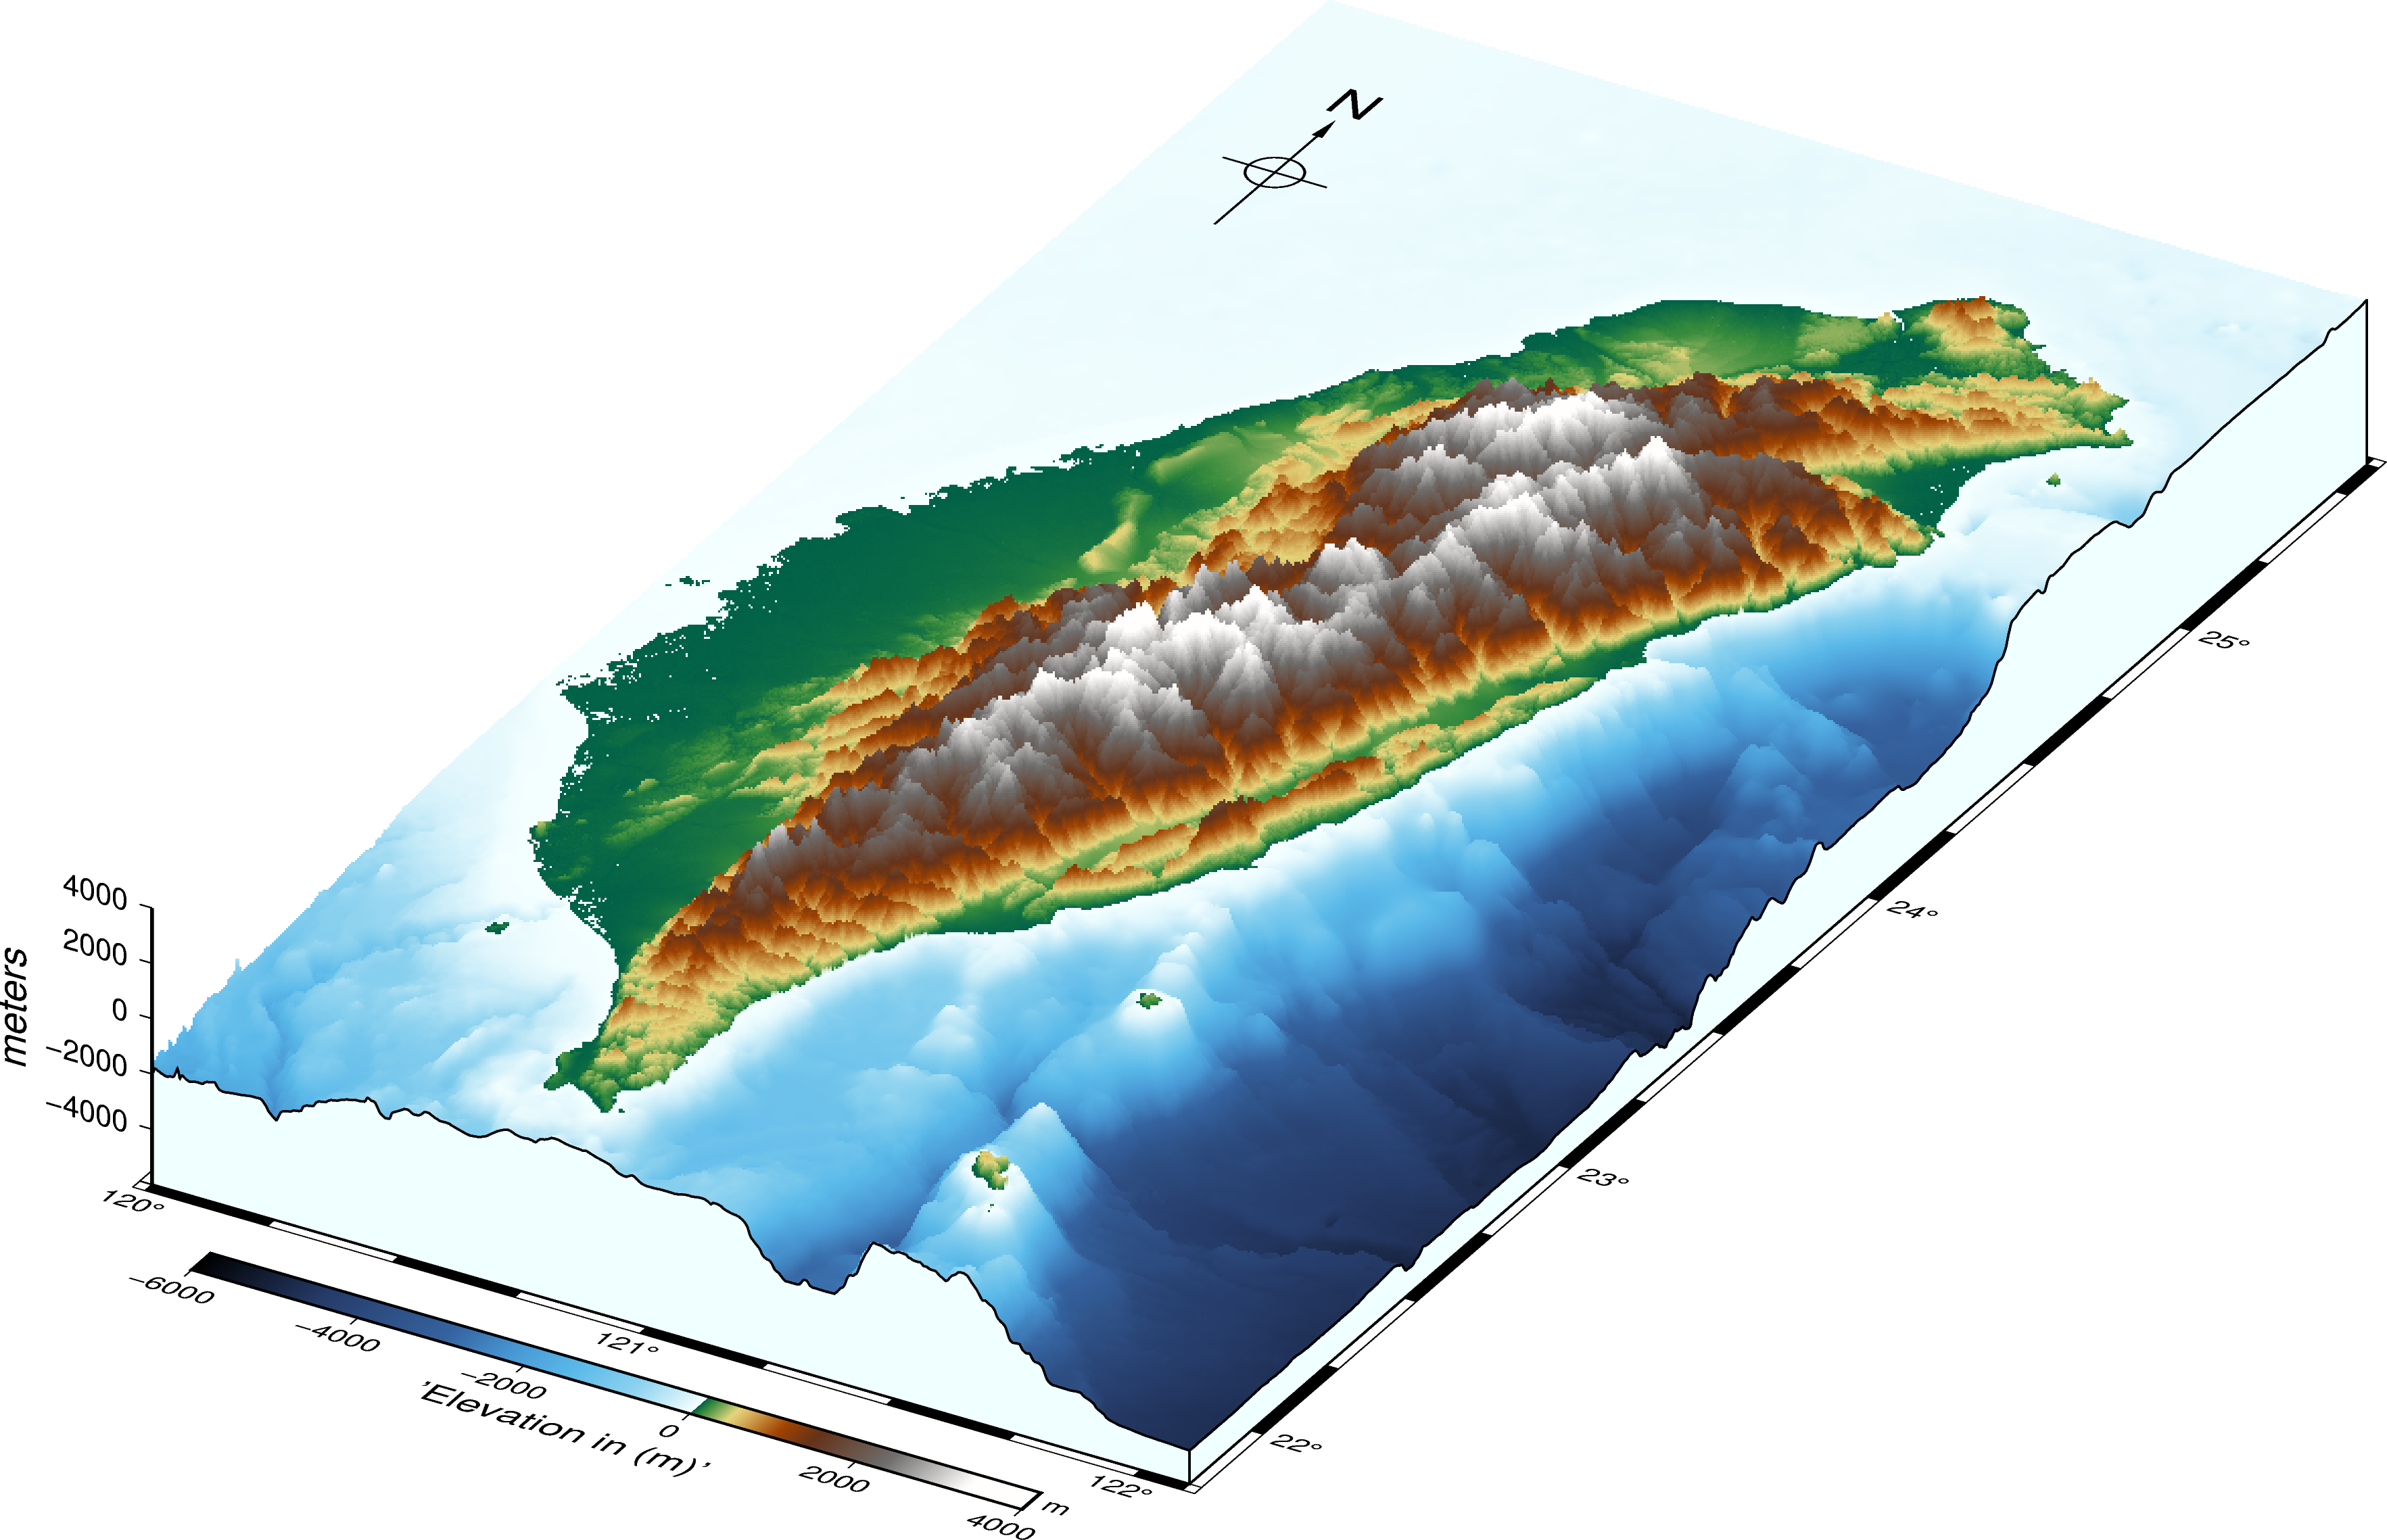
Please note that there’s difference in the map scale for the GMT and PyGMT case. This comes because of the different scales we took in the two cases. We took -JM3ior 3 inch Mercator projection in the case of GMT and M15c or 15 cm Mercator in case of PyGMT.
Recap
grdview= 3-D,grdimage= 2-D.grdviewdrapes the elevation grid as a surface with a z-axis.- Perspective is two angles. Azimuth (compass direction you view from) and elevation (height above the horizon):
-p150/25in GMT,perspective=[150, 30]in PyGMT. - Auto-downloaded relief.
@earth_relief_01m(GMT) /load_earth_relief(resolution="03s")(PyGMT) fetch topography on demand — no manual data hunting. - Same engine, two front-ends. PyGMT is a Python wrapper over GMT, so the map is identical; pick whichever fits your workflow.
- Modern PyGMT: use
contour_pen(notcontourpen).
Where to go next
- The 2-D GMT/PyGMT foundation: High-quality maps using the modern interface to GMT
- Overlay earthquakes on this base map (2-D): Plot earthquakes on a topographic map
- Overlay earthquakes in 3-D: Plot earthquakes on a three-dimensional topographic map
- PyGMT
grdviewdocs: pygmt.org/latest/api/generated/pygmt.Figure.grdview.html
Disclaimer of liability
The information provided by the Earth Inversion is made available for educational purposes only.
Whilst we endeavor to keep the information up-to-date and correct. Earth Inversion makes no representations or warranties of any kind, express or implied about the completeness, accuracy, reliability, suitability or availability with respect to the website or the information, products, services or related graphics content on the website for any purpose.
UNDER NO CIRCUMSTANCE SHALL WE HAVE ANY LIABILITY TO YOU FOR ANY LOSS OR DAMAGE OF ANY KIND INCURRED AS A RESULT OF THE USE OF THE SITE OR RELIANCE ON ANY INFORMATION PROVIDED ON THE SITE. ANY RELIANCE YOU PLACED ON SUCH MATERIAL IS THEREFORE STRICTLY AT YOUR OWN RISK.
Leave a comment