Source code of seismoalert
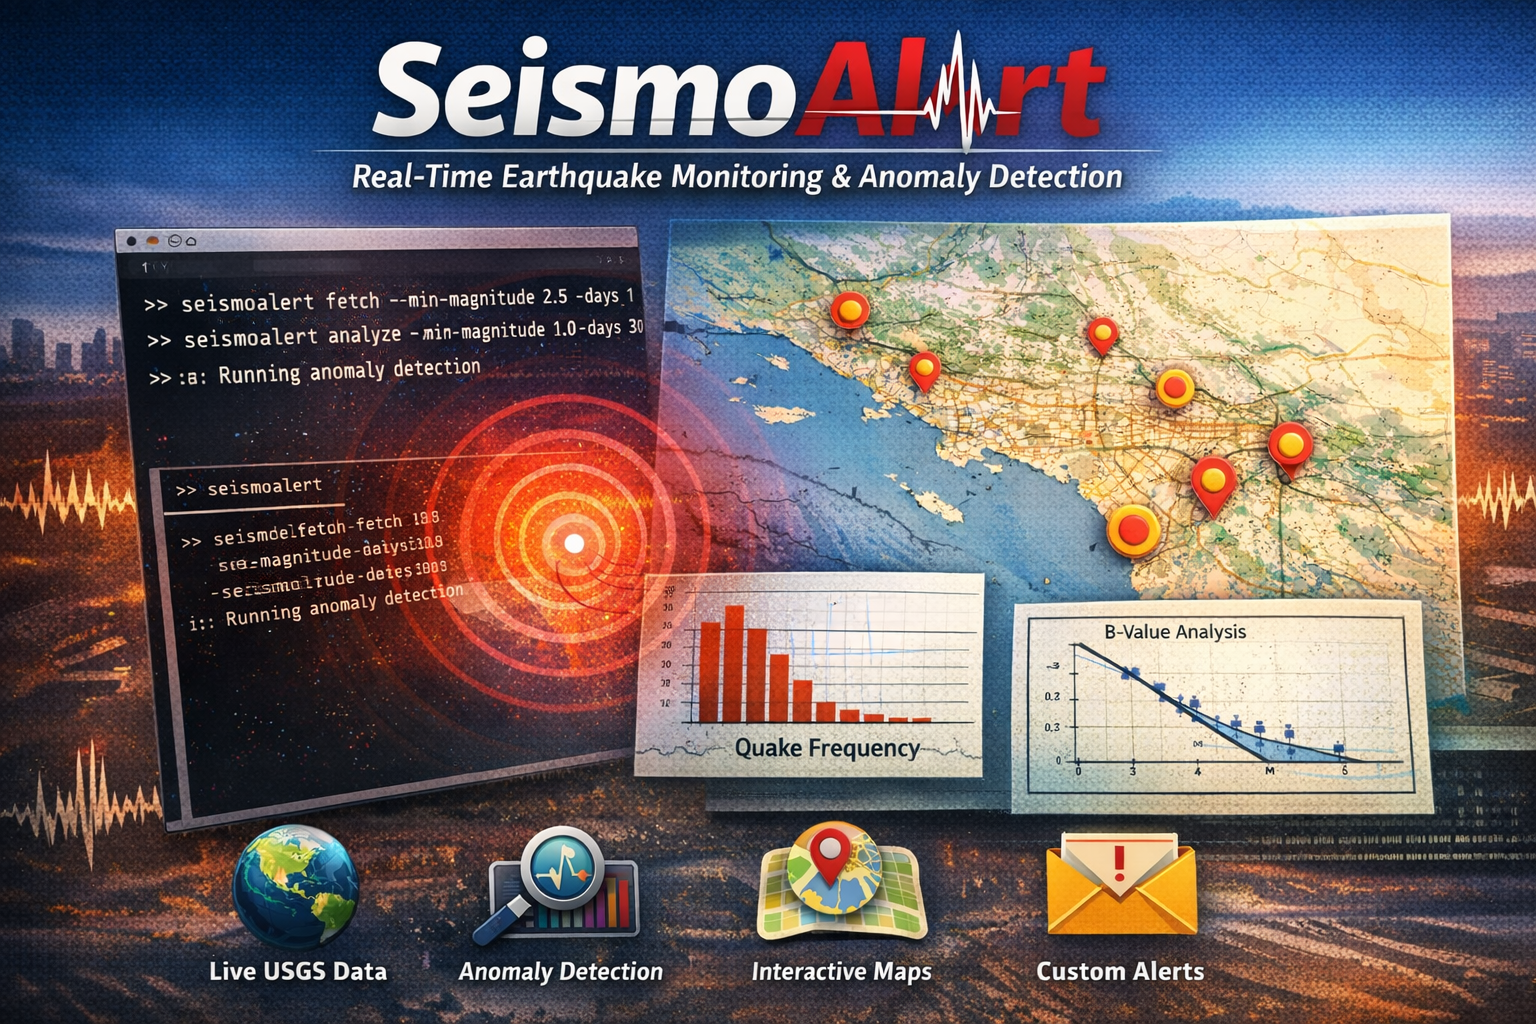
I built SeismoAlert as a real-time earthquake monitoring and anomaly detection toolkit using USGS earthquake data.

I built SeismoAlert as a real-time earthquake monitoring and anomaly detection toolkit using USGS earthquake data.
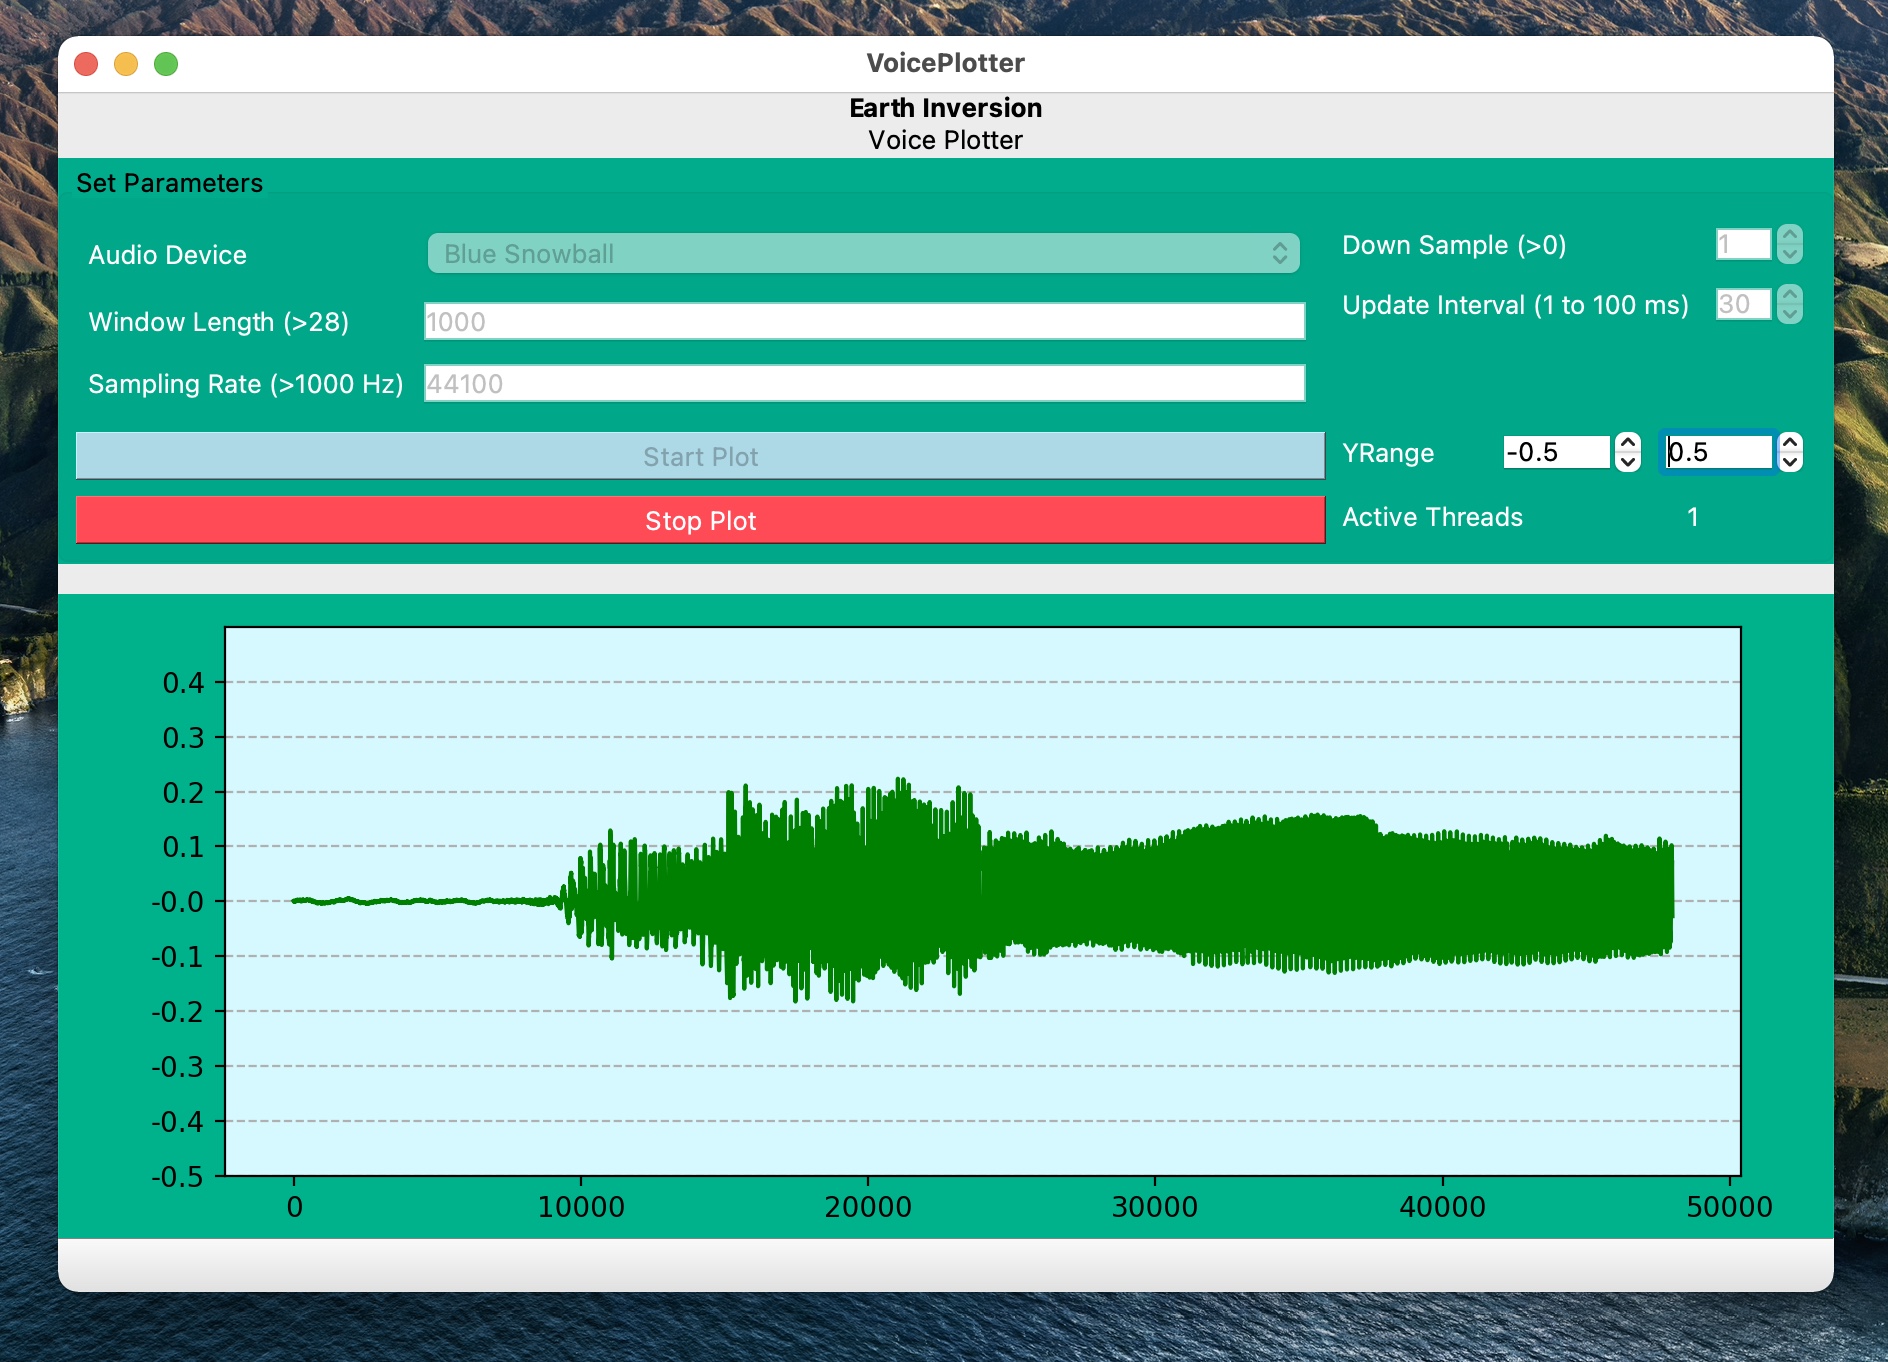
An application for retrieving and visualizing ambient sound waveforms in real time
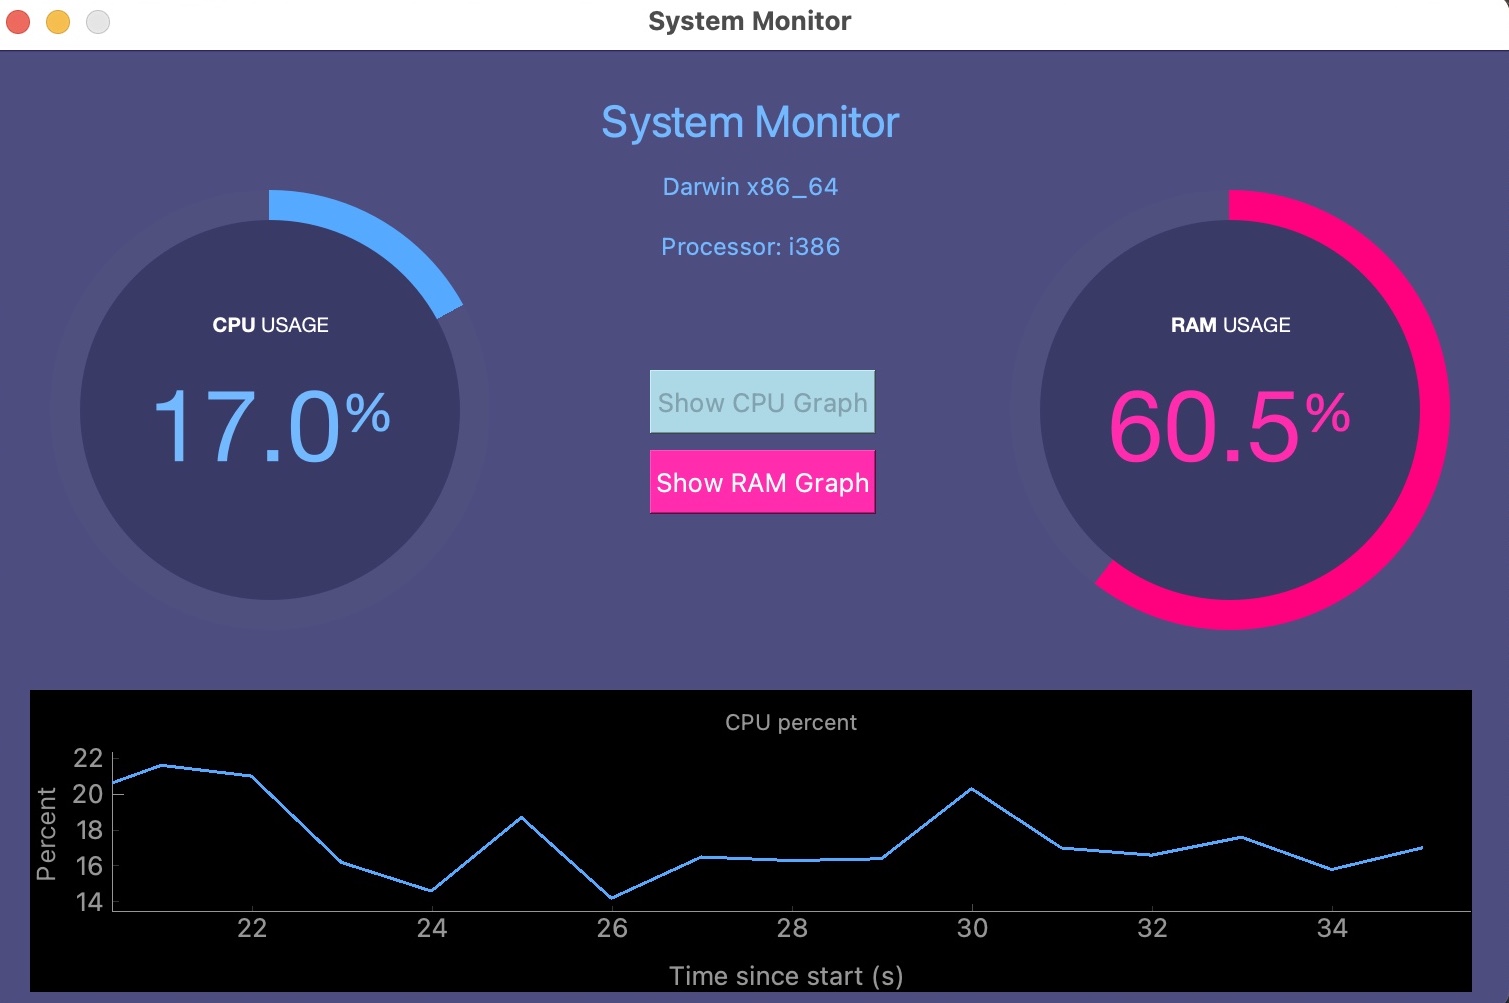
I built this system monitor app with PyQt5, pyqtgraph, and psutil to track CPU and RAM usage in real time across macOS, Linux, and Windows.
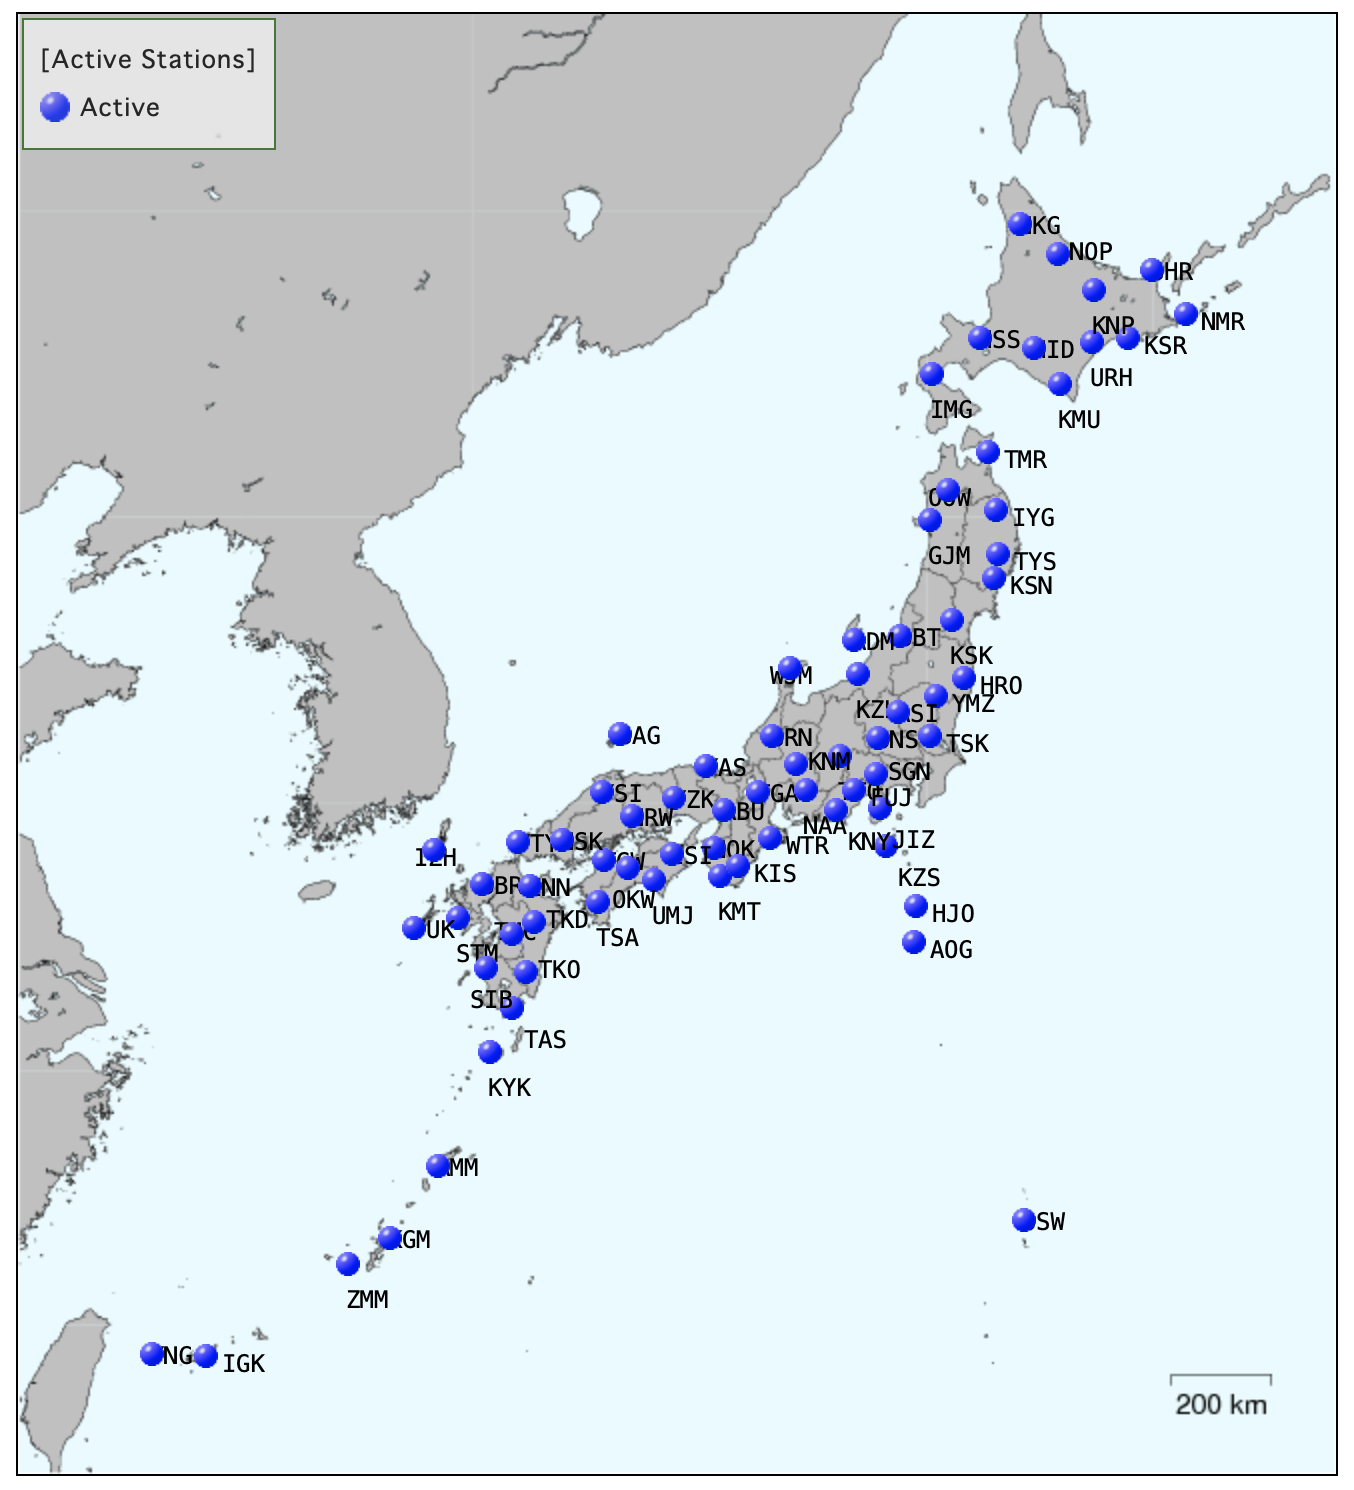
Selenium codes to download Fnet data automatically