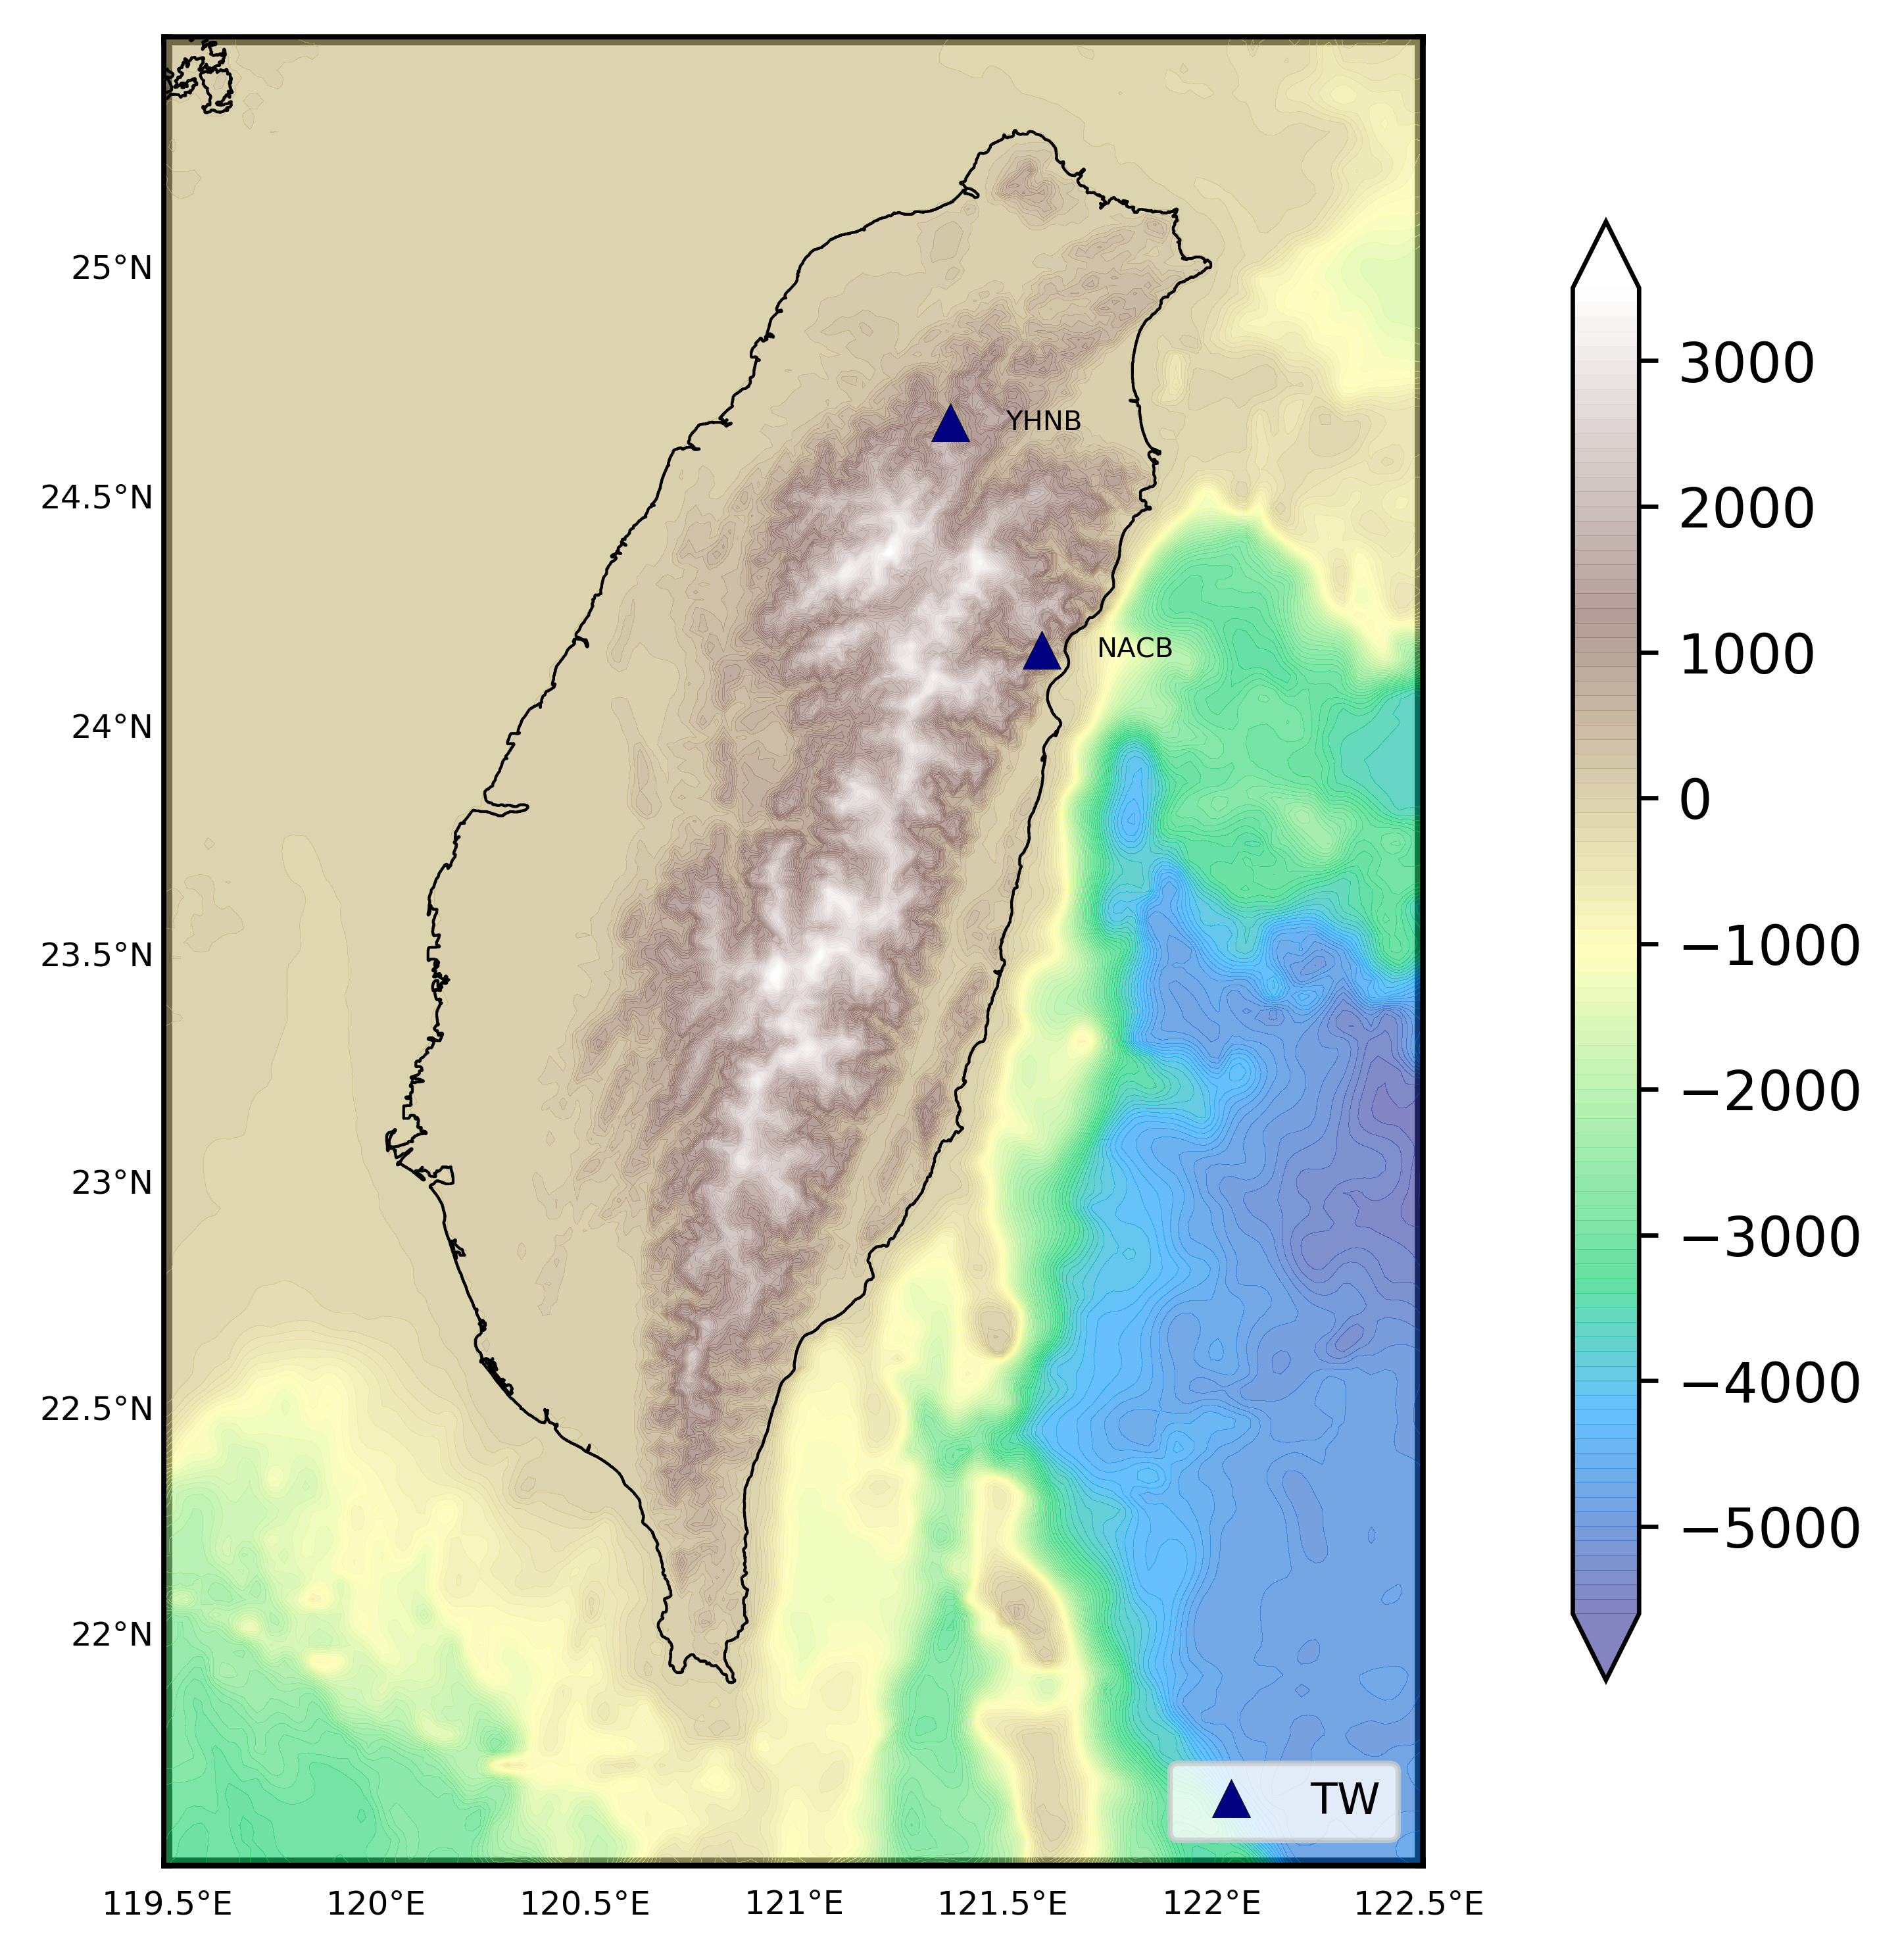
How to plot topographic station map in Python (codes included)
In this post, we read the station information stored in the text file statlist2.txt using the pandas library in Python and then plot it over the topographic map. The details on how to plot the topographic map in Python can be found here. The plot_topo_netcdf function can be used from here.
Requirements
You will need two files for the below script to run:
statlist2.txtfile with the format as:TW NACB latval lonval eleval TW YHNB latval lonval elevalReplace the
latval,lonvalandelevalwith appropriate values.- Set the path to the
etopo_filedownloaded from NOAA website.
Code
from plotting_topo import plot_topo, plot_topo_netcdf
from mpl_toolkits.basemap import Basemap
import matplotlib.pyplot as plt
import numpy as np
import pandas as pd

stn_df = pd.read_csv('statlist2.txt',header=None,sep='\s+',names=['net','sta','lat','lon','ele'])

etopo_file = "/Users/utpalkumar50/Documents/bin/ETOPO1_Bed_g_gmt4.grd"

lonmin, lonmax = 119.5,122.5 # minimum and maximum of the longitudes
latmin, latmax = 21.5,25.5 # minimum and maximum of the latitudes

if stn_df['lat'].min()<latmin or stn_df['lat'].max()>latmax or stn_df['lon'].min()<lonmin or stn_df['lon'].max()>lonmax:
    print("GEOGRAPHICAL RANGE ERROR: Stations outside the range")

else:
    networkset = set([val for val in stn_df['net']]) #making unique set of network for legend
    stations = [val for val in stn_df['sta']] #list of stations for marking on map
    color=iter(plt.cm.jet(np.linspace(0,1,len(networkset)))) #unique set of colors based on "jet" colormap for legend
    netcolor = {net:c for net, c in zip(networkset, color)} #one legend for each network

    fig = plt.figure(figsize=(10,6))
    ax = fig.add_subplot(111)
    map = Basemap(projection='merc',resolution = 'f', area_thresh = 10000., llcrnrlon=lonmin, llcrnrlat=latmin,urcrnrlon=lonmax, urcrnrlat=latmax)
    cs = plot_topo_netcdf(map,etopo_file=etopo_file,cmap='terrain',lonextent=(lonmin, lonmax),latextent=(latmin, latmax),zorder=2)
    fig.colorbar(cs, ax=ax, shrink=0.8)
    map.drawcoastlines(color='k',linewidth=0.5)
    map.drawcountries(color='k',linewidth=0.1)

    parallelmin,parallelmax = int(latmin), int(latmax)+1
    map.drawparallels(np.arange(parallelmin, parallelmax+1,0.5).tolist(),labels=[1,0,0,0],linewidth=0,fontsize=6)
    meridianmin,meridianmax = int(lonmin),int(lonmax)+1
    map.drawmeridians(np.arange(meridianmin, meridianmax+1,0.5).tolist(),labels=[0,0,0,1],linewidth=0,fontsize=6)
    map.drawmapboundary(color='k', linewidth=2, zorder=1)

    for lon, lat, sta, net in zip(stn_df['lon'],stn_df['lat'],stn_df['sta'],stn_df['net']):
        x,y = map(lon, lat)
        plt.text(x+25000, y, sta, ha="center", va="center",fontsize=5)
        map.plot(x, y,'^',color=netcolor[net], markersize=7,markeredgecolor='k',linewidth=0.1,markeredgewidth=0.1)
    for net in networkset:
        map.plot(np.NaN,np.NaN,'^',color=netcolor[net],label=net, markersize=7,markeredgecolor='k',linewidth=0.1,markeredgewidth=0.1)
    plt.legend(loc=4,fontsize=8)
    plt.savefig('station_map.png',bbox_inches='tight',dpi=600)
    plt.close('all')
Disclaimer of liability
The information provided by the Earth Inversion is made available for educational purposes only.
Whilst we endeavor to keep the information up-to-date and correct. Earth Inversion makes no representations or warranties of any kind, express or implied about the completeness, accuracy, reliability, suitability or availability with respect to the website or the information, products, services or related graphics content on the website for any purpose.
UNDER NO CIRCUMSTANCE SHALL WE HAVE ANY LIABILITY TO YOU FOR ANY LOSS OR DAMAGE OF ANY KIND INCURRED AS A RESULT OF THE USE OF THE SITE OR RELIANCE ON ANY INFORMATION PROVIDED ON THE SITE. ANY RELIANCE YOU PLACED ON SUCH MATERIAL IS THEREFORE STRICTLY AT YOUR OWN RISK.
Leave a comment