What is Pink Noise and how is it different from White Noise?
Introduction
Pink noise — also called 1/f noise or flicker noise — is a random signal with equal energy per octave. The name is an analogy to pink light, whose power spectrum falls off with frequency. It turns up all over nature (and is a favorite of computer-music composers), which makes it worth understanding alongside its flatter cousin, white noise.
The one distinction
It’s all in the power spectrum $S(f)$:
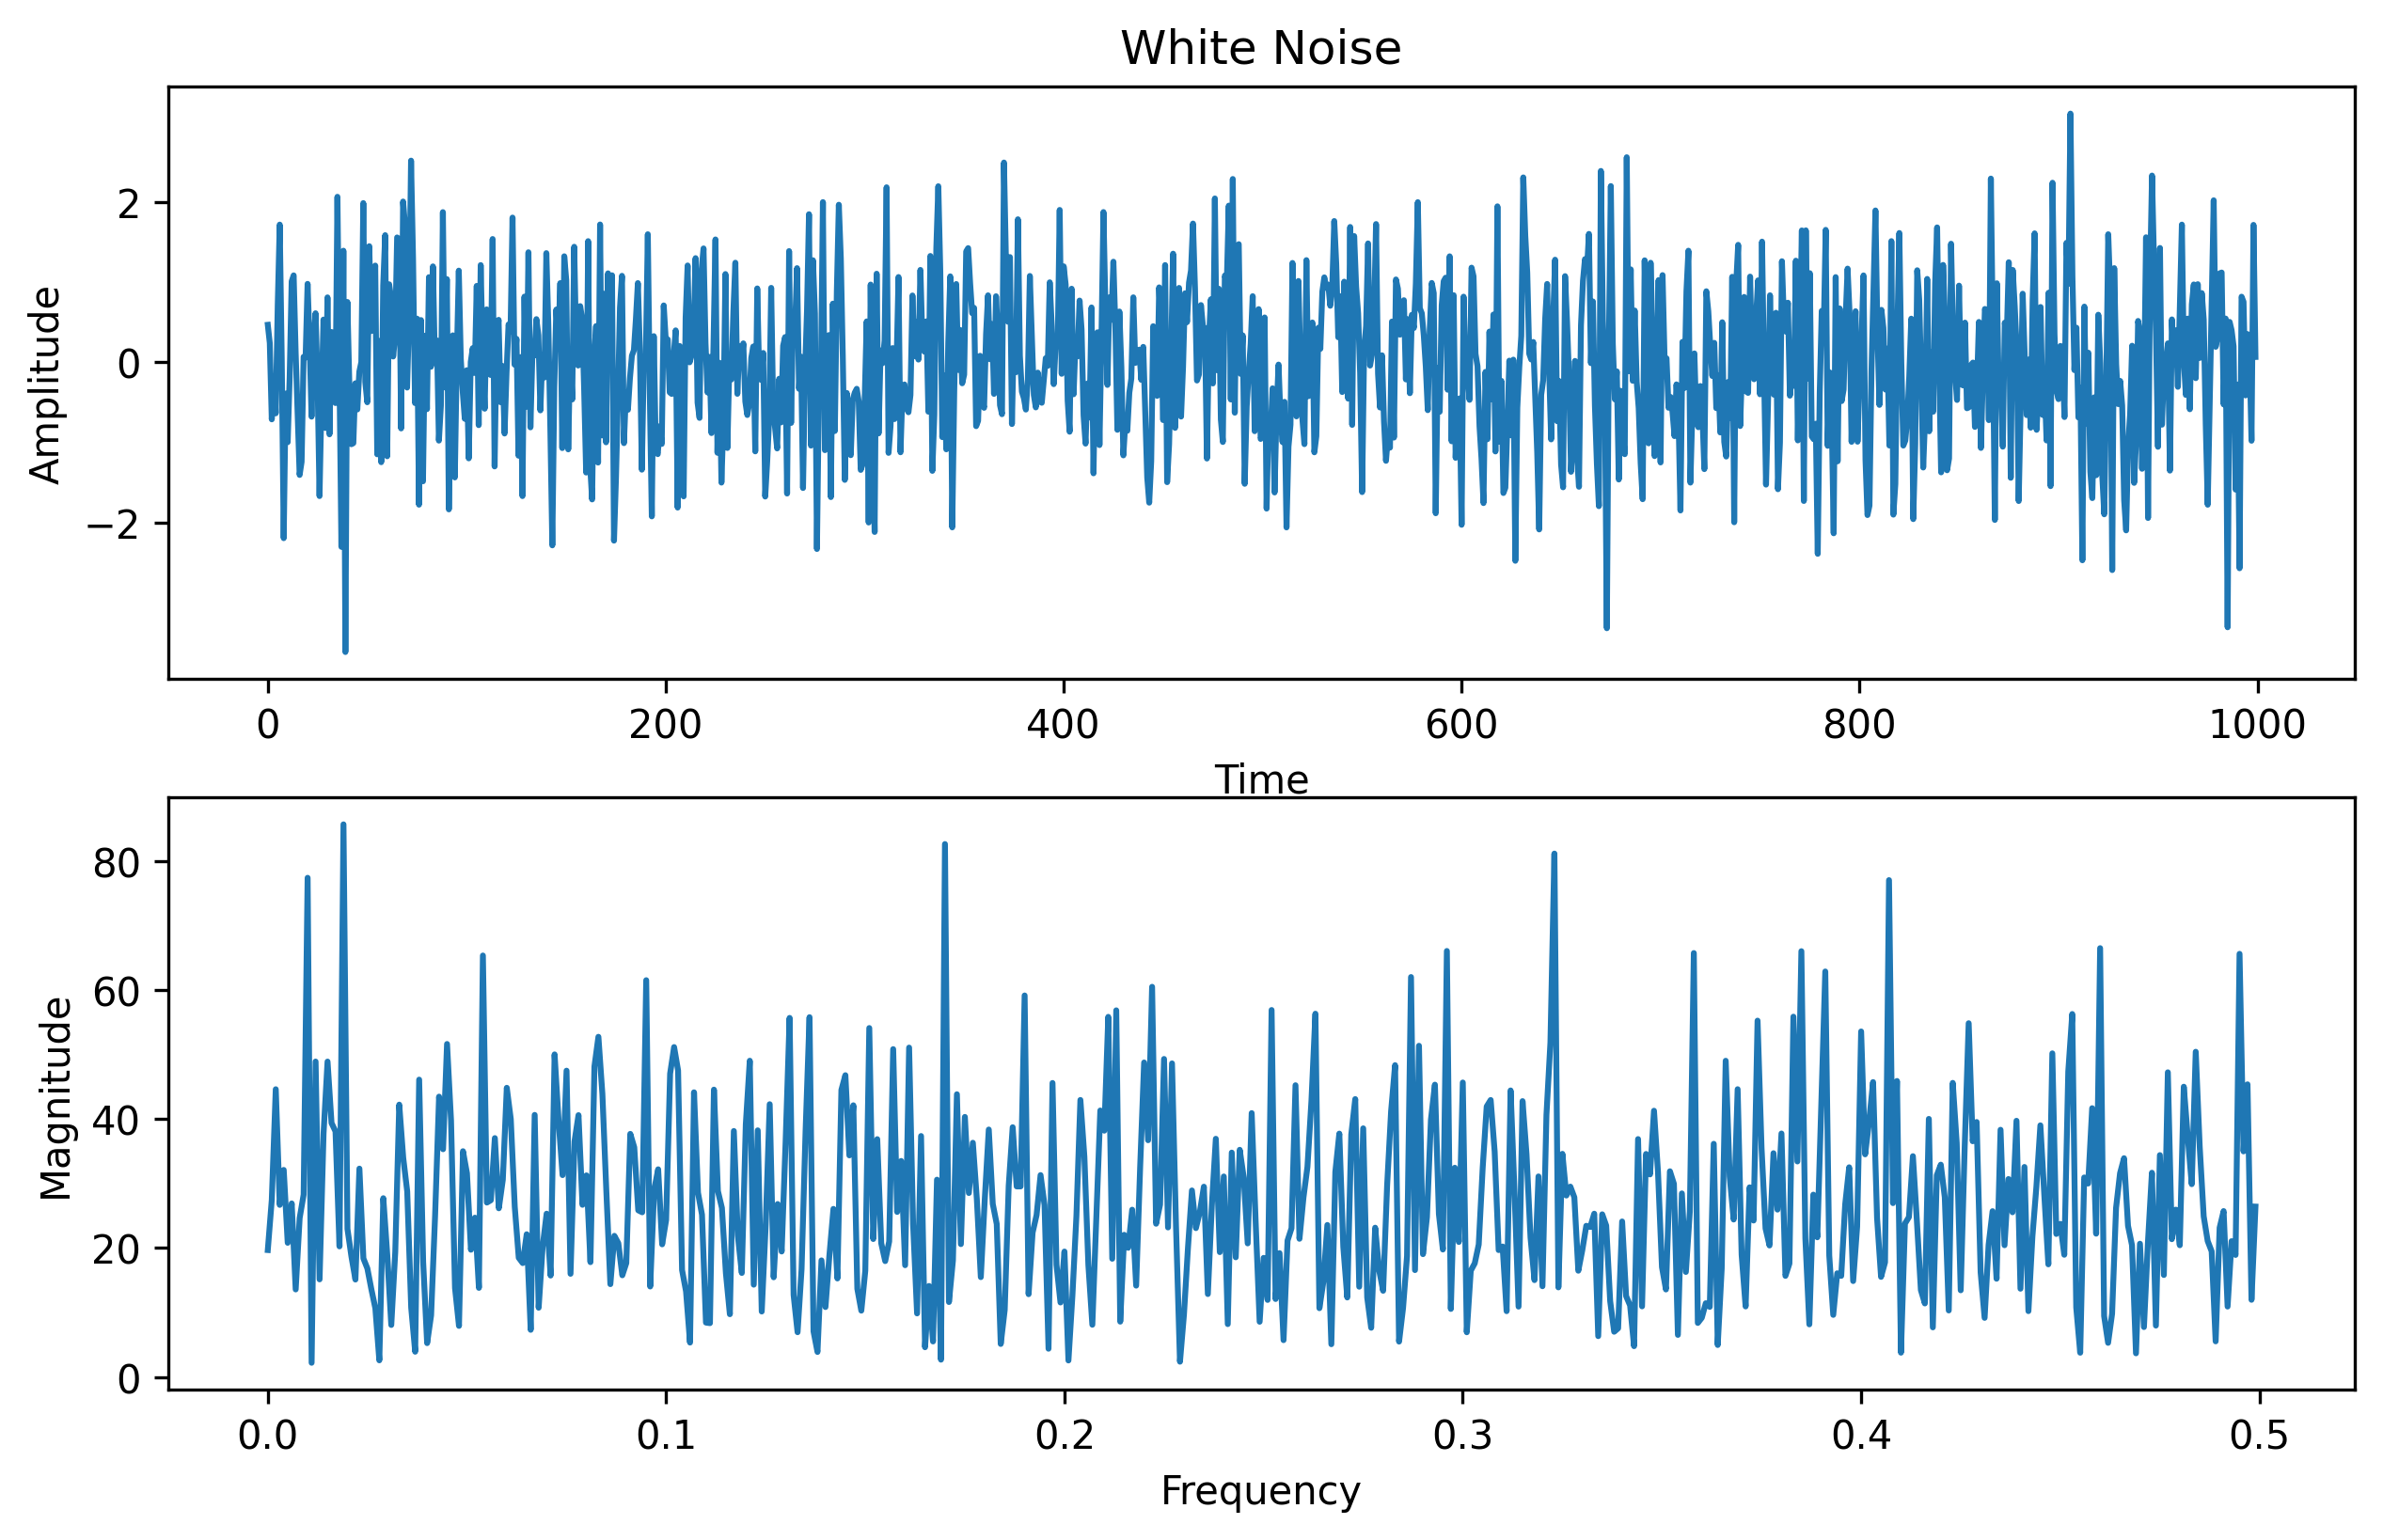
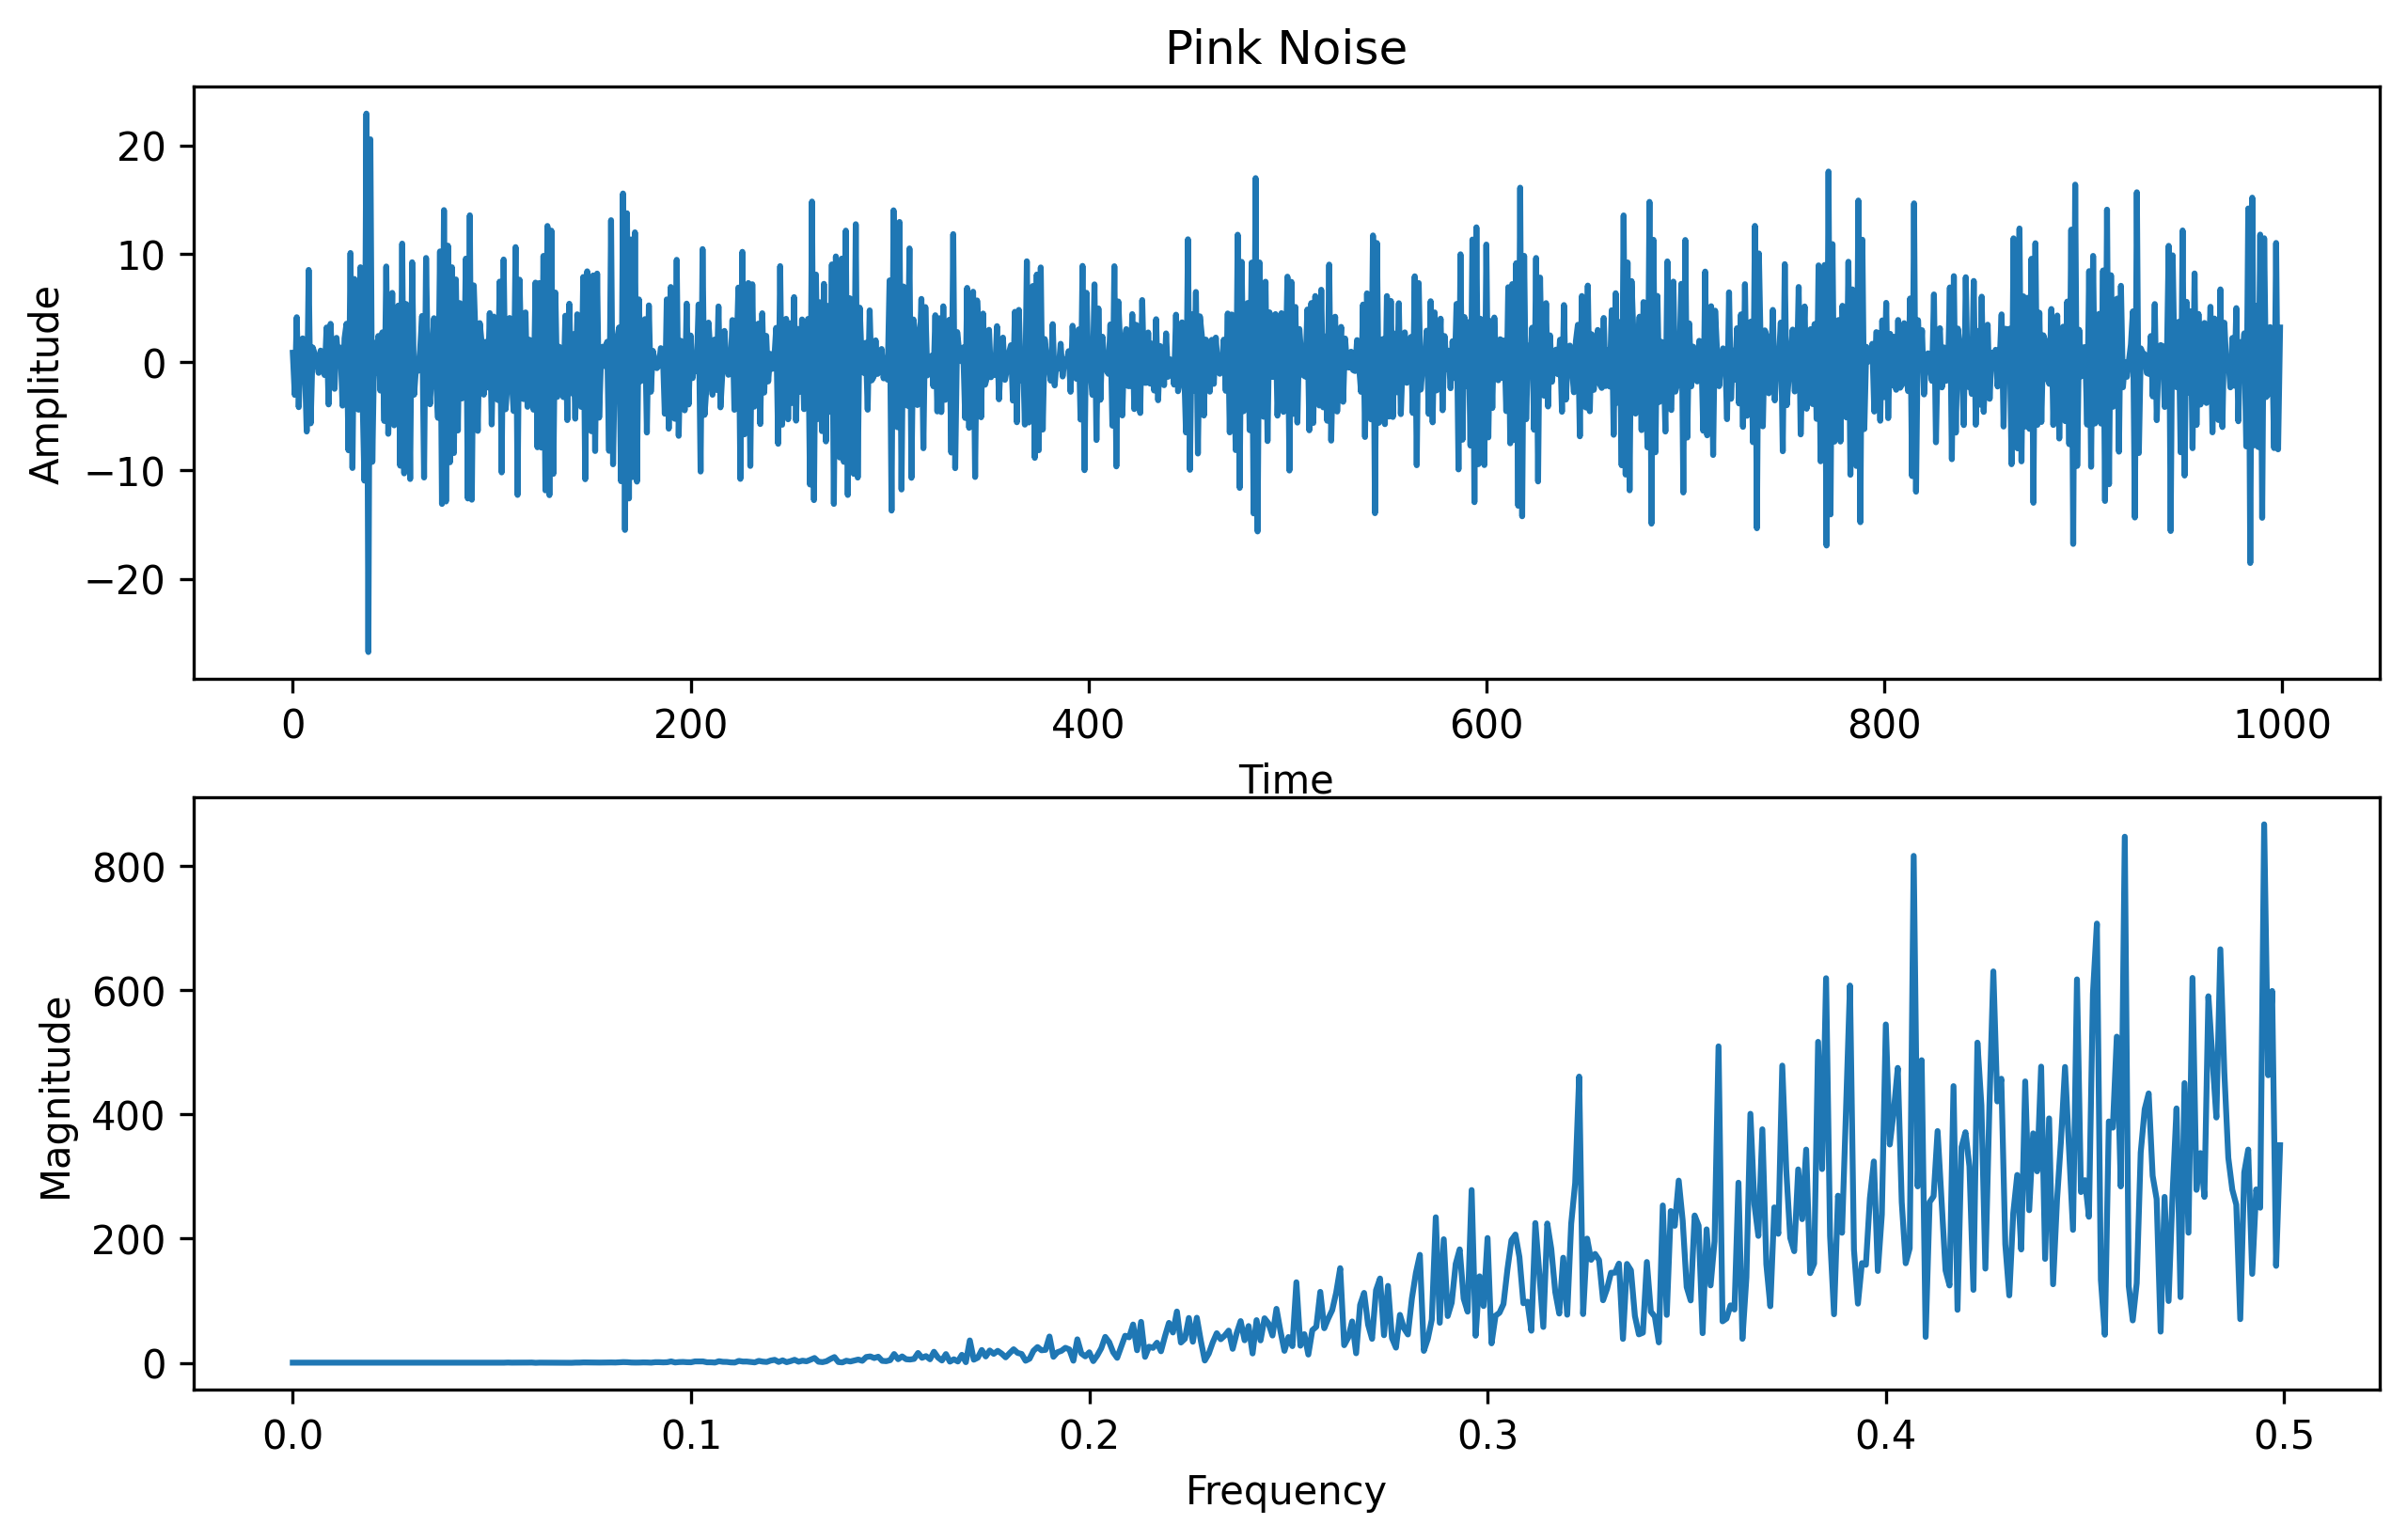
\[S_{\text{white}}(f) \propto \text{const}, \qquad S_{\text{pink}}(f) \propto \frac{1}{f}\]White noise spreads power equally across all frequencies (flat spectrum). Pink noise puts more power at low frequencies, decreasing by half each octave — equal power per octave rather than per hertz.
How is pink noise different from white noise?
Both are random signals, but they differ across three dimensions:
| Aspect | White noise | Pink noise |
|---|---|---|
| Spectral distribution | Flat — equal power at all frequencies | Power halves per octave (1/f) — more low-frequency energy |
| Correlation | Independent samples, no correlation | Long-range correlations; each sample depends on the past |
| Perceived sound | Hiss/static; masks background, tests audio gear | Balanced, “soothing”; used in audio, acoustics, sleep/relaxation |
Compared with white noise, where does pink noise concentrate its power?
Synthesis of white noise in Python
To generate white noise in Python, we can use the NumPy library, which provides a function called numpy.random.randn() to generate white noise.
## Generating White Noise
import numpy as np
import matplotlib.pyplot as plt

def generate_white_noise(samples):
    white_noise = np.random.randn(samples)
    return white_noise

# Generate 1000 samples of pink noise
samples = 1000
white_noise = generate_white_noise(samples)

# Compute the frequency spectrum using FFT
spectrum = np.fft.fft(white_noise)
freq = np.fft.fftfreq(samples)

# Consider only positive frequencies
positive_freq = freq[:samples // 2]
positive_spectrum = spectrum[:samples // 2]

# Plotting the pink noise
fig, ax = plt.subplots(2, 1, figsize=(10,6))
ax[0].plot(white_noise)
ax[0].set_title("White Noise")
ax[0].set_xlabel("Time")
ax[0].set_ylabel("Amplitude")

ax[1].plot(positive_freq, np.abs(positive_spectrum))
ax[1].set_xlabel("Frequency")
ax[1].set_ylabel("Magnitude")

plt.savefig('white_noise_synthesis.png', dpi=300, bbox_inches='tight')
plt.close()
Synthesis of pink noise in Python
To generate pink noise in Python, we can use the NumPy library, which provides a function called numpy.random.randn() to generate white noise. Then, we can then apply a filter to the white noise signal to convert it into pink noise.
## Generating Pink Noise
import numpy as np
import matplotlib.pyplot as plt
np.random.seed(10250)

def generate_pink_noise(samples):
    b = [0.049922035, -0.095993537, 0.050612699, -0.004408786]
    a = [1, -2.494956002, 2.017265875, -0.522189400]

    pink_noise = np.random.randn(samples)
    pink_noise = np.convolve(pink_noise, b)
    pink_noise = np.convolve(pink_noise, a, mode='valid')
    return pink_noise / 0.091420942

# Generate 1000 samples of pink noise
samples = 1000
pink_noise = generate_pink_noise(samples)

# Compute the frequency spectrum using FFT
spectrum = np.fft.fft(pink_noise)
freq = np.fft.fftfreq(samples)

# Consider only positive frequencies
positive_freq = freq[:samples // 2]
positive_spectrum = spectrum[:samples // 2]

# Plotting the pink noise
fig, ax = plt.subplots(2, 1, figsize=(10,6))
ax[0].plot(pink_noise)
ax[0].set_title("Pink Noise")
ax[0].set_xlabel("Time")
ax[0].set_ylabel("Amplitude")

ax[1].plot(positive_freq, np.abs(positive_spectrum))
ax[1].set_xlabel("Frequency")
ax[1].set_ylabel("Magnitude")

plt.savefig('pink_noise_synthesis.png', dpi=300, bbox_inches='tight')
plt.close()
The trick is the filter: white noise (flat spectrum) is passed through the IIR filter defined by
coefficients b and a, whose frequency response approximates a 1/f roll-off — turning the flat
spectrum into the pink one.
Recap
Without scrolling up — what separates the two?
- White noise: $S(f) \propto \text{const}$ — flat spectrum, independent samples, hiss-like.
- Pink noise: $S(f) \propto 1/f$ — more low-frequency power, long-range correlations, “balanced” sound.
- In code: generate white noise with
np.random.randn, then filter it (theb/acoefficients) to impose the 1/f roll-off that makes it pink.
References
- "1/f noise" in Music: Music from 1/f Noise — Voss & Clarke, 1978, The Journal of the Acoustical Society of America, 63(1), 258–263.
Disclaimer of liability
The information provided by the Earth Inversion is made available for educational purposes only.
Whilst we endeavor to keep the information up-to-date and correct. Earth Inversion makes no representations or warranties of any kind, express or implied about the completeness, accuracy, reliability, suitability or availability with respect to the website or the information, products, services or related graphics content on the website for any purpose.
UNDER NO CIRCUMSTANCE SHALL WE HAVE ANY LIABILITY TO YOU FOR ANY LOSS OR DAMAGE OF ANY KIND INCURRED AS A RESULT OF THE USE OF THE SITE OR RELIANCE ON ANY INFORMATION PROVIDED ON THE SITE. ANY RELIANCE YOU PLACED ON SUCH MATERIAL IS THEREFORE STRICTLY AT YOUR OWN RISK.
Leave a comment