GMT Advanced Tutorial (codes included)
Introduction
For basic tutorial, please visit here.
This tutorial consists of Bash script files to run the GMT. The data files required to run the scripts can be downloaded from here. Most codes are minor modifications of the GMT historical collections.
Bash Scripts
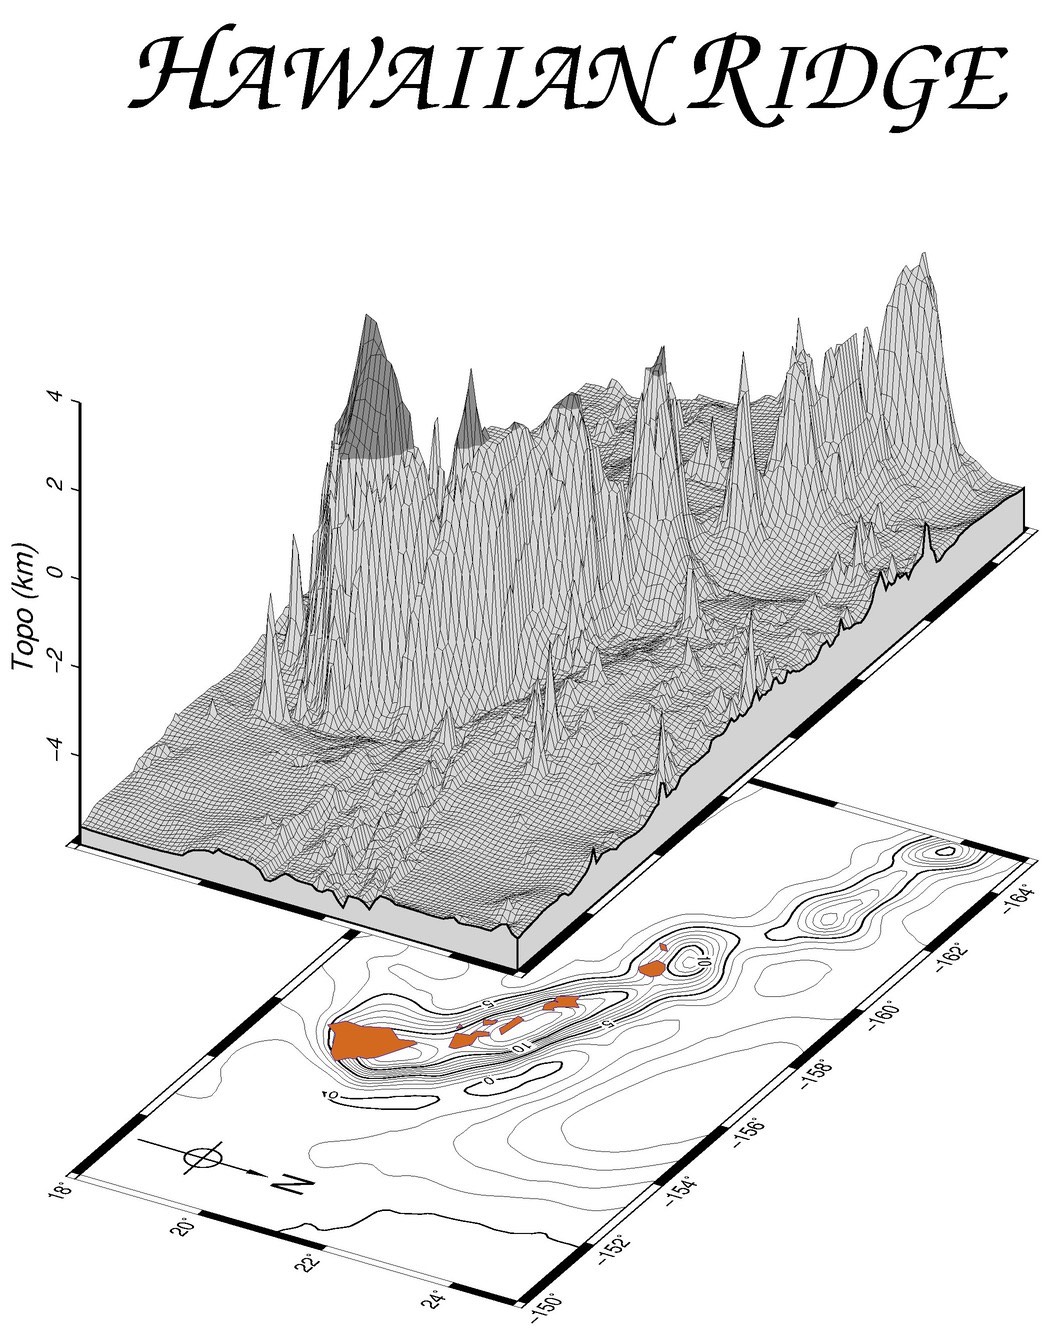
Plotting three-dimensional mesh
![]()
#!/bin/bash
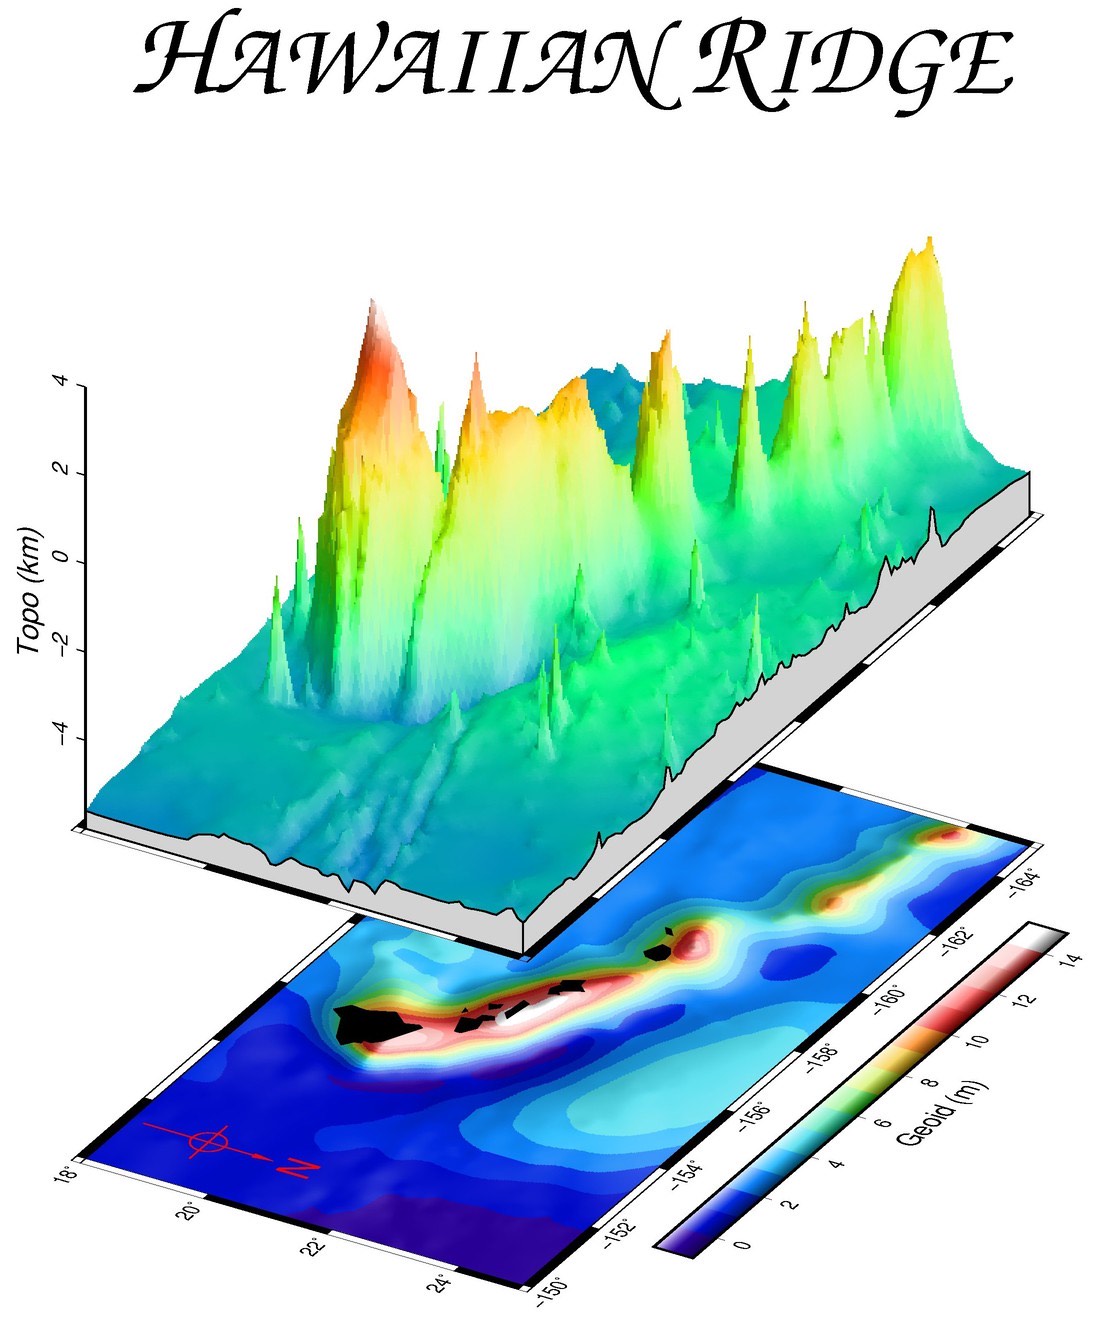
# Purpose: 3-D mesh and color plot of Hawaiian topography and geoid
#
ctr="-Xc -Yc"
for i in 1 2
do
fig[i]="Figures/GMT_example2-${i}.ps"
done
gmt makecpt -C255,100 -T-10/10/10 -N > zero.cpt #-C: specifies the color to build linear continuous cpt, -T: zmin, zmax, zinc
gmt grdcontour Data/HI_geoid4.nc -R195/210/18/25 -Jm0.45i -p60/30 -C1 -A5+o -Gd4i -K -P \
-X1.25i -Y1.25i > ${fig[1]} #-pazm/elev, -Ccontour_interval, -Aannot_interval+o->rounded rectangle box, Gd-> distances between the labels on the plots
gmt pscoast -R -J -p -B2 -BNEsw -Gchocolate -W0.1,blue -O -K -TdjBR+o0.1i+w1i+l >> ${fig[1]} #-Td draws a map directional rose on the map at the
# location defined by the reference and anchor points, -G-> filling of dry areas
#-Rxmin/xmax/ymin/ymax/zmin/zmax if -Jz specified
gmt grdview Data/HI_topo4.nc -R195/210/18/25/-6/4 -J -Jz0.34i -p -Czero.cpt -O -K \
-N-6+glightgray -Qsm -B2 -Bz2+l"Topo (km)" -BneswZ -Y2.2i >> ${fig[1]}
echo '3.25 5.75 H@#awaiian@# R@#idge@#' | gmt pstext -R0/10/0/10 -Jx1i \
-F+f60p,ZapfChancery-MediumItalic+jCB -O >> ${fig[1]}
rm -f zero.cpt
#
gmt grdgradient Data/HI_geoid4.nc -A0 -Gg_intens.nc -Nt0.75 -fg #-Aazm, -Goutput_grdfile, -Nt-> normalization using cumulative cauchy distribution
gmt grdgradient Data/HI_topo4.nc -A0 -Gt_intens.nc -Nt0.75 -fg #-fg -> geographic grids in meters
gmt grdimage Data/HI_geoid4.nc -Ig_intens.nc -R195/210/18/25 -JM6.75i -p60/30 -CData/geoid.cpt -E100 \
-K -P -X1.25i -Y1.25i > ${fig[2]} #-Iintensity_file, -Eresolution
gmt pscoast -R -J -p -B2 -BNEsw -Gblack -O -K >> ${fig[2]}
gmt psbasemap -R -J -p -O -K -TdjBR+o0.1i+w1i+l --COLOR_BACKGROUND=red --FONT=red \
--MAP_TICK_PEN_PRIMARY=thinner,red >> ${fig[2]}
gmt psscale -R -J -p240/30 -DJBC+o0/0.5i+w5i/0.3i+h -CData/geoid.cpt -I -O -K -Bx2+l"Geoid (m)" >> ${fig[2]}
gmt grdview Data/HI_topo4.nc -It_intens.nc -R195/210/18/25/-6/4 -J -JZ3.4i -p60/30 -CData/topo.cpt \
-O -K -N-6+glightgray -Qc100 -B2 -Bz2+l"Topo (km)" -BneswZ -Y2.2i >> ${fig[2]}
echo '3.25 5.75 H@#awaiian@# R@#idge@#' | gmt pstext -R0/10/0/10 -Jx1i \
-F+f60p,ZapfChancery-MediumItalic+jCB -O >> ${fig[2]}
rm -f *_intens.nc
rm -f *.history
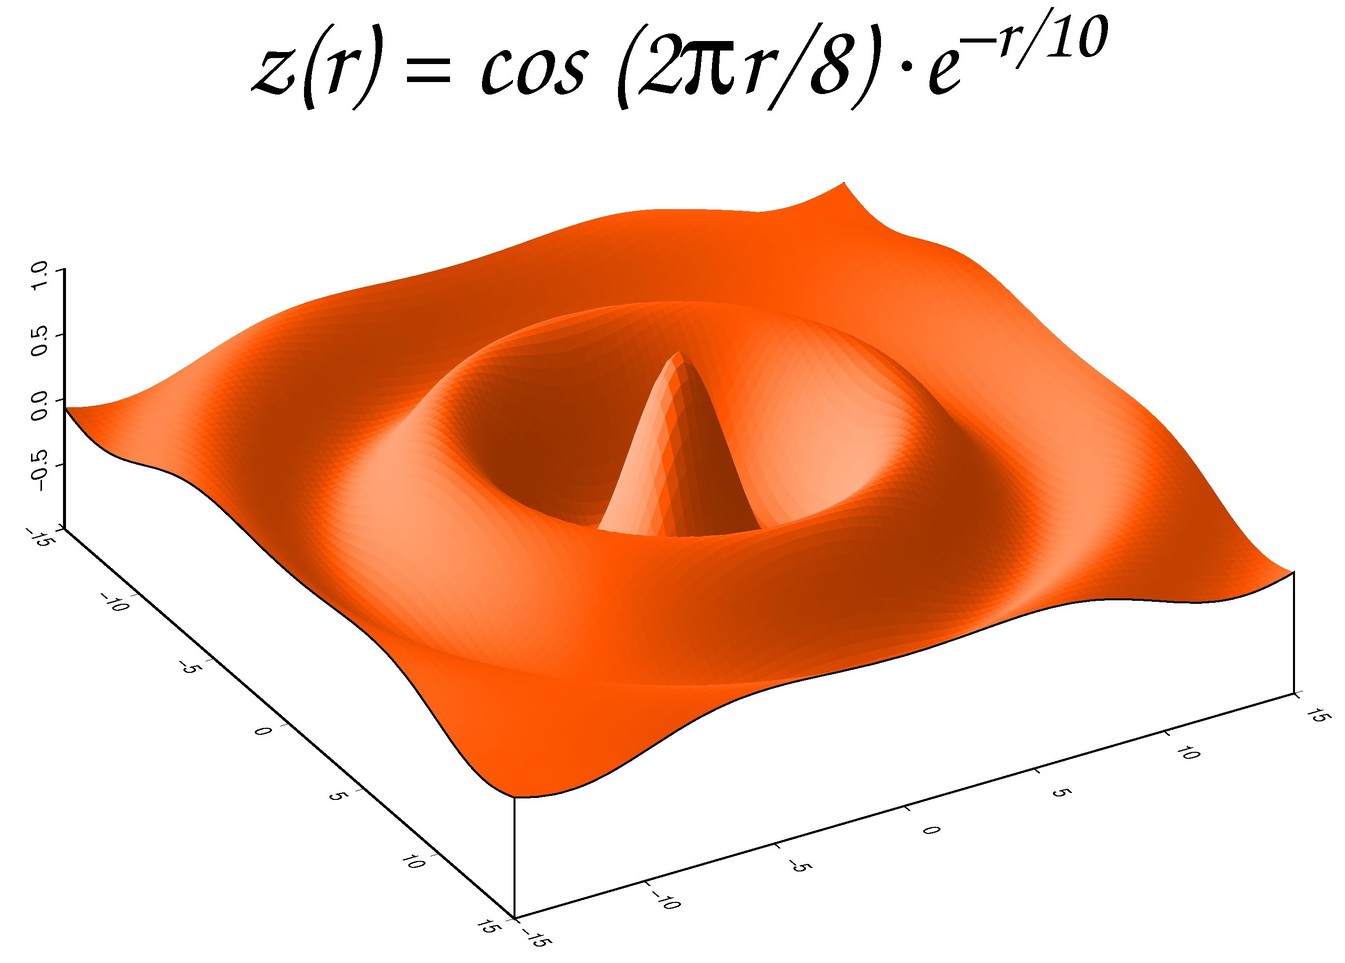
Plotting three-dimensional surface
![]()
#!/bin/bash
# Purpose: Generate grid and show monochrome 3-D perspective

#
ctr="-Xc -Yc"
for i in 1
do
	fig[i]="Figures/GMT_example3-${i}.ps"
done
<!-- Ads disabled -->


gmt grdmath -R-15/15/-15/15 -I0.3 X Y HYPOT DUP 2 MUL PI MUL 8 DIV COS EXCH NEG 10 DIV \
	EXP MUL = sombrero.nc #-Igrid_spacing, X, Y grid with X and Y coordinates, HYPOT - hypotenuse, DUP - duplicate, EXCH - exchange A and B on stack
gmt makecpt -Chot -T-5/5 -N > g.cpt
gmt grdgradient sombrero.nc -A225 -Gintensity.nc -Nt0.75
gmt grdview sombrero.nc -JX6i -JZ2i -B5 -Bz0.5 -BSEwnZ -N-1+gwhite -Qs -Iintensity.nc -X1.5i \
	-Cg.cpt -R-15/15/-15/15/-1/1 -K -p120/30 > ${fig[1]}
echo "4.1 5.5 z(r) = cos (2@~p@~r/8) @~\327@~e@+-r/10@+" | gmt pstext -R0/11/0/8.5 -Jx1i \
	-F+f50p,ZapfChancery-MediumItalic+jBC -O >> ${fig[1]}
rm -f g.cpt sombrero.nc intensity.nc *.history
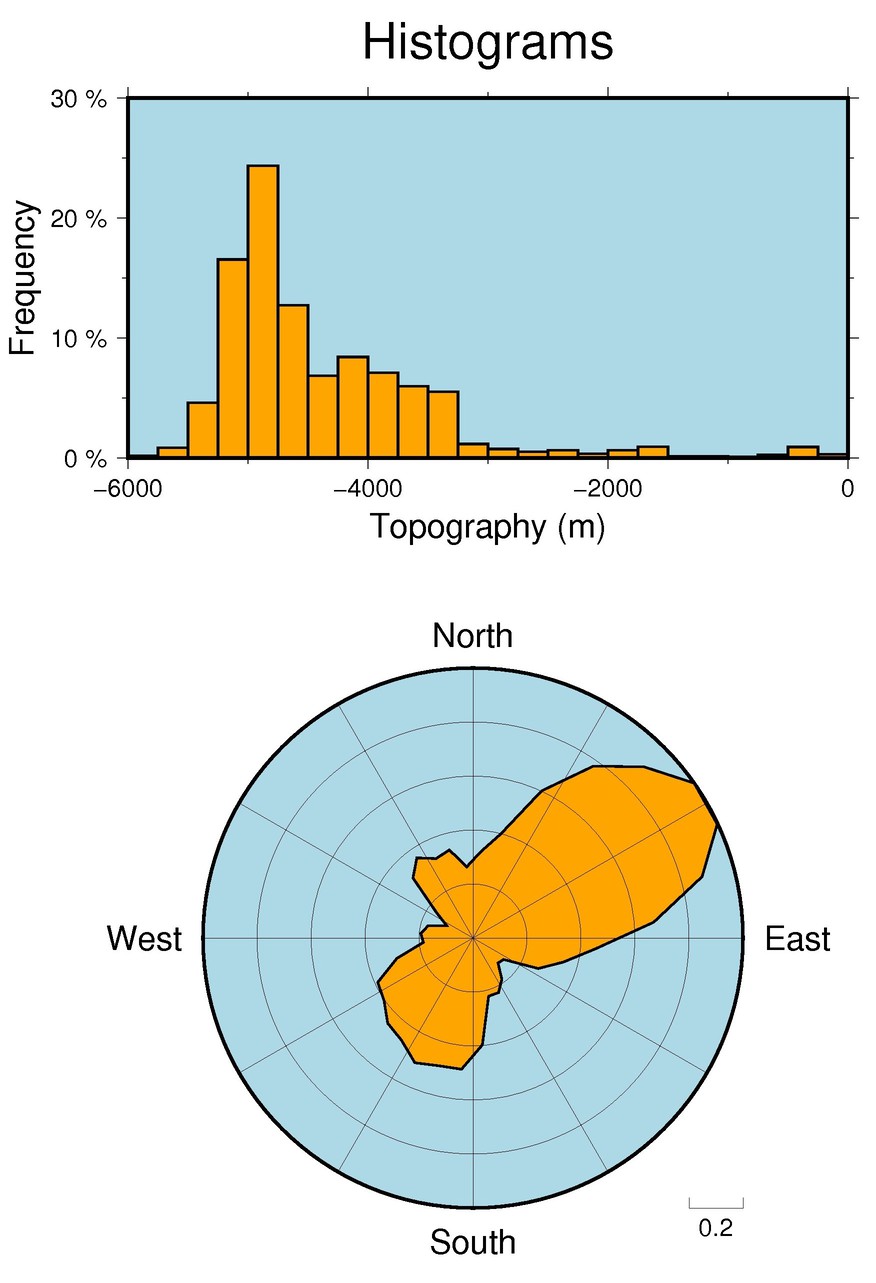
Plot histograms (standard and polar)
![]()
#!/bin/bash

ctr="-Xc -Yc"
for i in 1
do
	fig[i]="Figures/GMT_example4-${i}.ps"
done

gmt psrose Data/fractures.d -: -A10r -S1.8in -P -Gorange -R0/1/0/360 -X2.5i -Y2i -K -Bx0.2g0.2 \
	-By30g30 -B+glightblue -W1p > ${fig[1]} #-Ar -> draw rose diagram, -Sn to normalize input radius
gmt pshistogram -Bxa2000f1000+l"Topography (m)" -Bya10f5+l"Frequency"+u" %" \
	-BWSne+t"Histograms"+glightblue Data/v3206.t -R-6000/0/0/30 -JX4.8i/2.4i -Gorange -O \
	-Y5.0i -X-0.5i -L1p -Z1 -W250 >> ${fig[1]} #-L1p-> bar outline thickness, Z1->frequency in percent, -Wbin_width
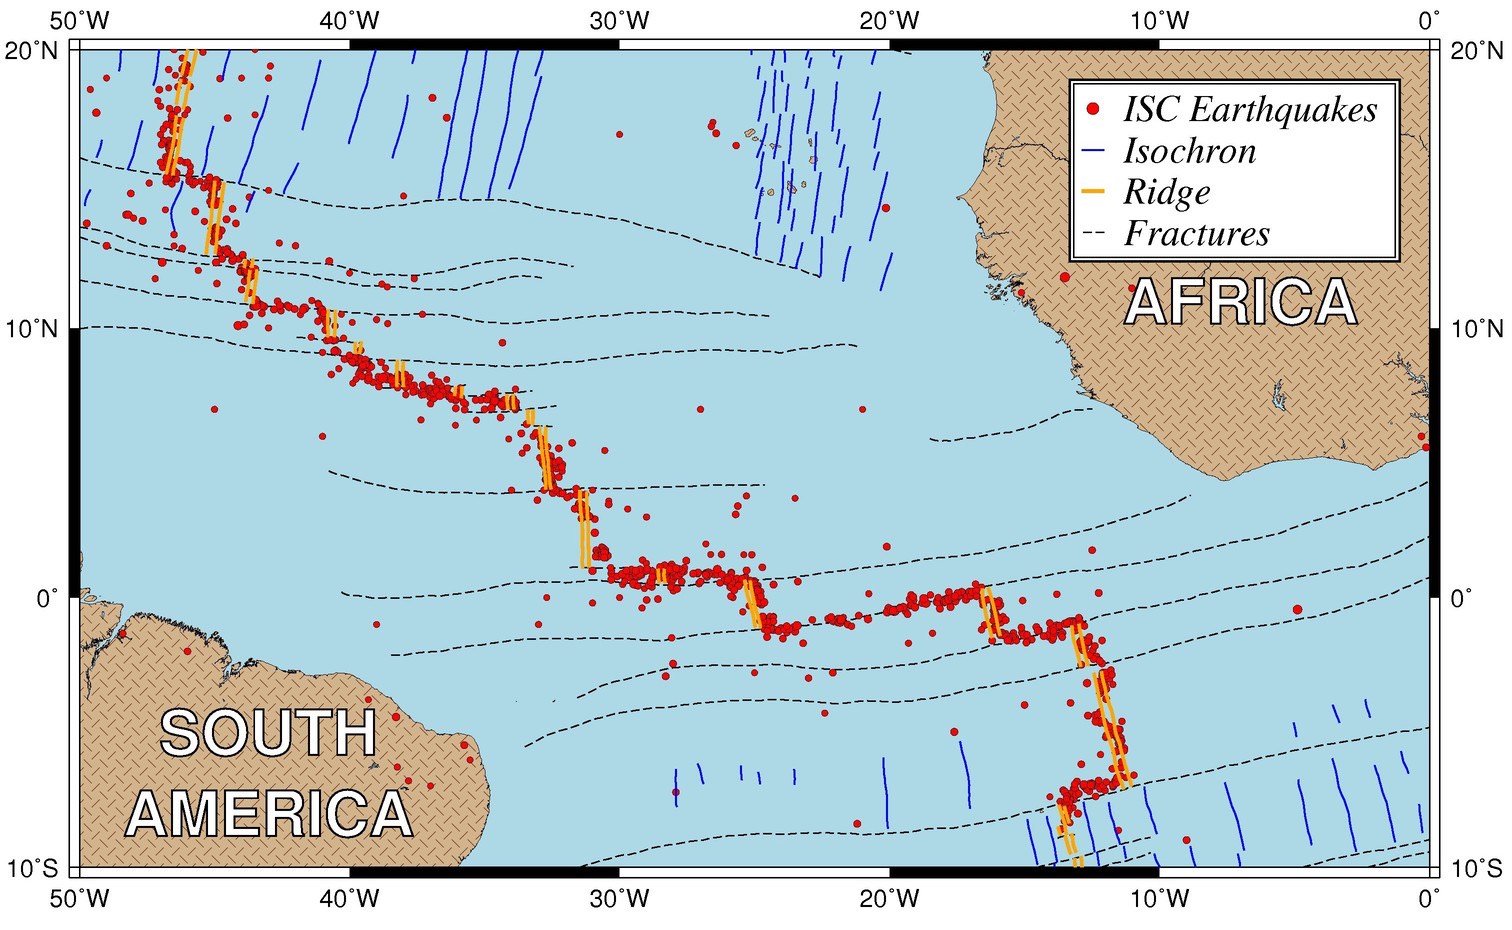
Plot basemap with earthquakes and isochrons etc
![]()
#!/bin/bash

ctr="-Xc -Yc"
for i in 1
do
	fig[i]="Figures/GMT_example5-${i}.ps"
done
gmt pscoast -R-50/0/-10/20 -JM9i -K -Slightblue -GP300/26:FtanBdarkbrown -Dh -Wthinnest \
	-B10 $ctr --FORMAT_GEO_MAP=dddF > ${fig[1]}
gmt psxy -R -J -O -K Data/fz.xy -Wthinner,-  >> ${fig[1]}
gmt psxy Data/quakes.xym -R -J -O -K -h1 -Sci -i0,1,2s0.01 -Gred -Wthinnest >> ${fig[1]} #-h1 skips header record
gmt psxy -R -J -O -K Data/isochron.xy -Wthin,blue >> ${fig[1]}
gmt psxy -R -J -O -K Data/ridge.xy -Wthicker,orange >> ${fig[1]}
gmt pslegend -R -J -O -K -DjTR+w2.2i+o0.2i -F+pthick+ithinner+gwhite --FONT_ANNOT_PRIMARY=18p,Times-Italic<< EOF >> ${fig[1]}
S 0.1i c 0.08i red thinnest 0.3i ISC Earthquakes
S 0.1i - 0.15i - thin,blue 0.3i Isochron
S 0.1i - 0.15i - thicker,orange 0.3i Ridge
S 0.1i - 0.15i - thinner,- 0.3i Fractures
EOF
#
gmt pstext -R -J -O -F+f30,Helvetica-Bold,white=thin >> ${fig[1]} << END
-43 -5 SOUTH
-43 -8 AMERICA
 -7 11 AFRICA
END

rm *.history
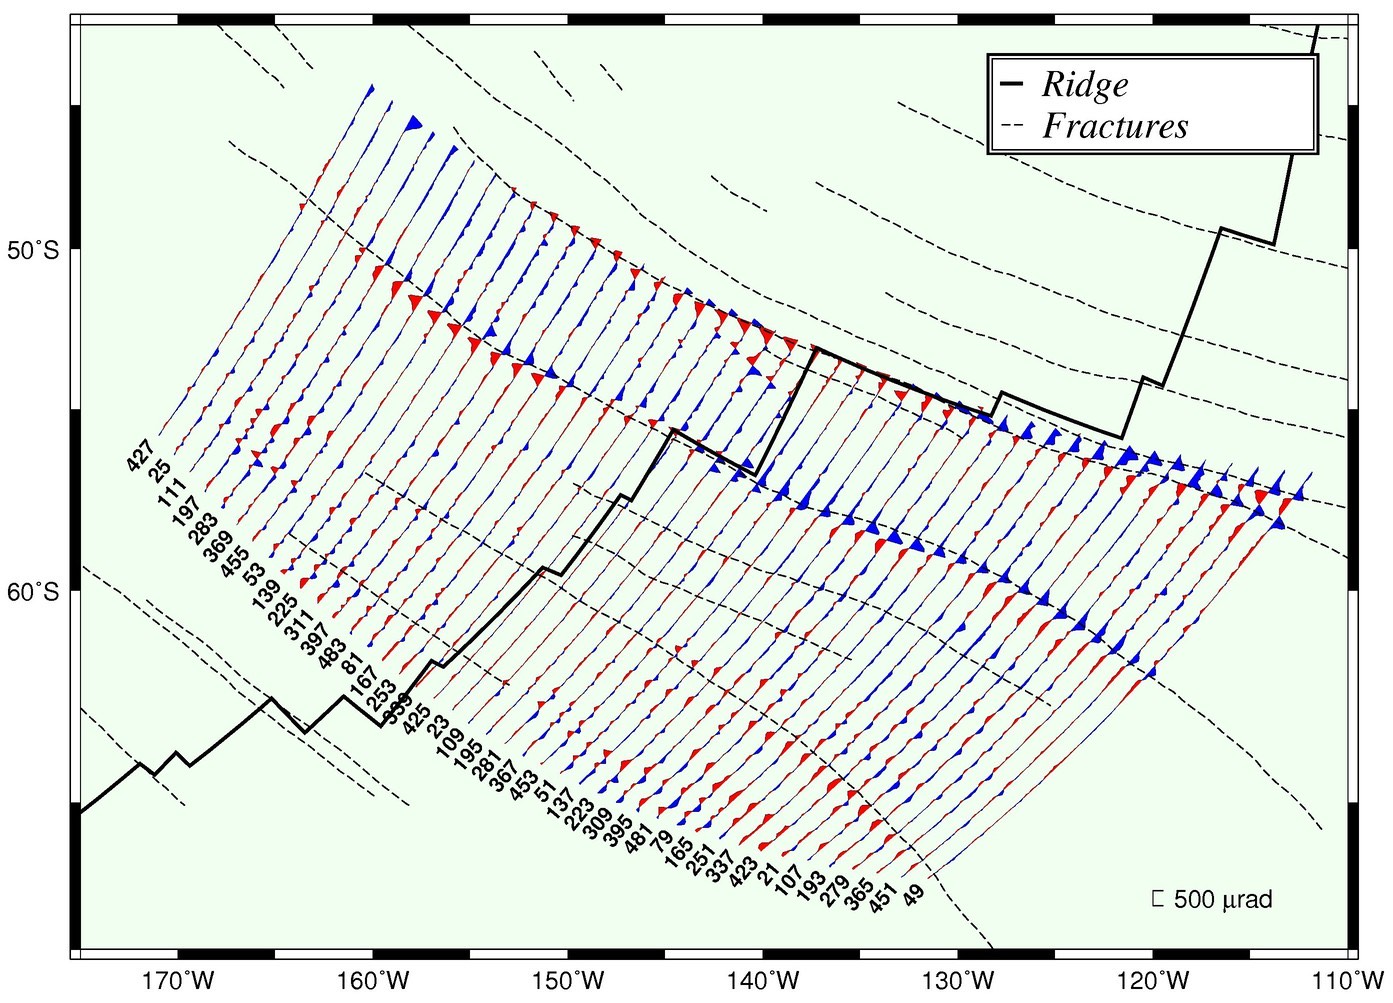
Plot wiggle along track from geoid deflections
![]()
#!/bin/bash

ctr="-Xc -Yc"
for i in 1
do
	fig[i]="Figures/GMT_example6-${i}.ps"
done


gmt pswiggle Data/tracks.txt -R185/250/-68/-42 -K -Jm0.13i -Ba10f5 -BWSne+g240/255/240 -G+red \
	-G-blue -Z2000 -Wthinnest -S240/-67/500/@~m@~rad --FORMAT_GEO_MAP=dddF > ${fig[1]} #-S dras simple vertical scale
#-Zanomaly_scale
gmt psxy -R -J -O -K Data/ridge2.xy -Wthicker >> ${fig[1]}

gmt psxy -R -J -O -K Data/fz2.xy -Wthinner,- >> ${fig[1]}
# Take label from segment header and plot near coordinates of last record of each track
gmt convert -El Data/tracks.txt | gmt pstext -R -J -F+f10p,Helvetica-Bold+a50+jRM+h \
	-D-0.05i/-0.05i -O -K >> ${fig[1]}
#-El -> extract last record of each segement e.g.
# > 107
#222.267	-66.2309	-3
gmt pslegend -R -J -O -DjTR+w2.2i+o0.2i -F+pthick+ithinner+gwhite --FONT_ANNOT_PRIMARY=18p,Times-Italic<< EOF >> ${fig[1]}
S 0.1i - 0.15i - thicker 0.3i Ridge
S 0.1i - 0.15i - thinner,- 0.3i Fractures
EOF

rm -f *.history
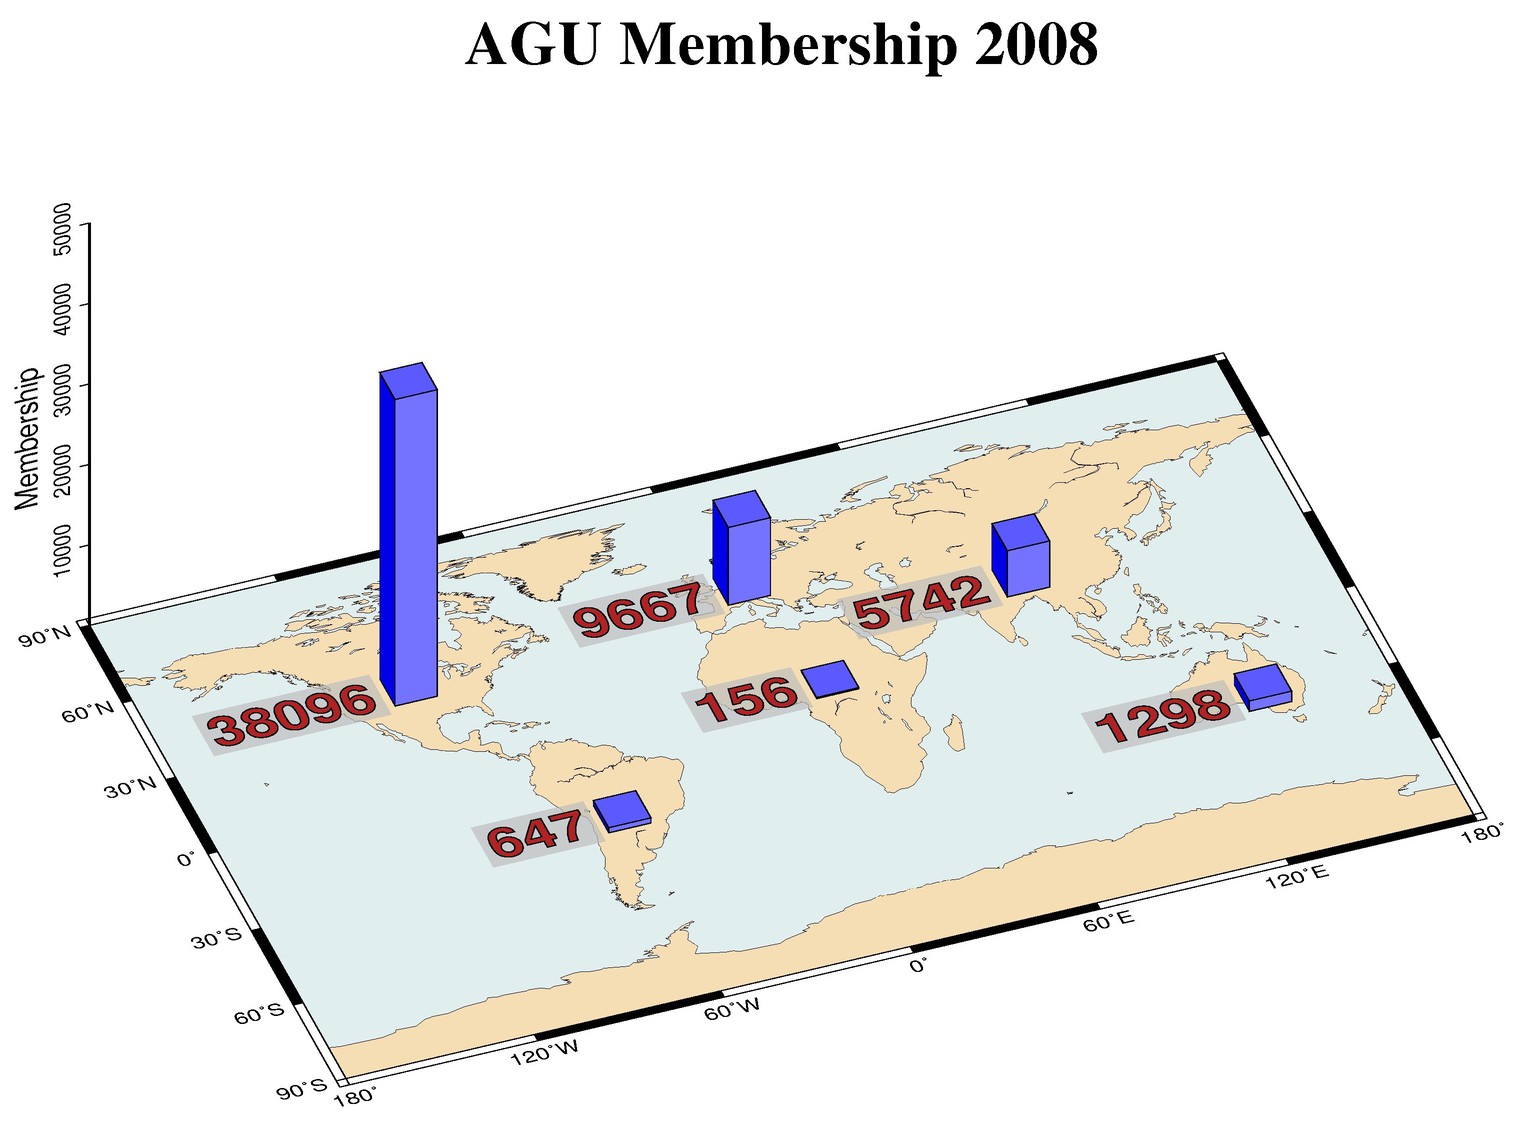
Plot 3-D bar graph on top of perspective map
![]()
#!/bin/bash

ctr="-Xc -Yc"
for i in 1
do
	fig[i]="Figures/GMT_example7-${i}.ps"
done

gmt pscoast -Rd -JX8id/5id -Dc -Sazure2 -Gwheat -Wfaint -A5000 -p200/40 -K > ${fig[1]}
awk '{print $1, $2, $3}' Data/agu2008.d \
	| gmt pstext -R -J -O -K -p -Ggray@30 -D-0.25i/0 \
	-F+f30p,Helvetica-Bold,firebrick=thinner+jRM >> ${fig[1]}
gmt psxyz Data/agu2008.d -R-180/180/-90/90/1/50000 -J -JZ3.5i -So0.3i -Gblue -Wthinner \
	--FONT_TITLE=30p,Times-Bold --MAP_TITLE_OFFSET=-0.7i -O -p --FORMAT_GEO_MAP=dddF \
	-Bx60 -By30 -Bza10000+lMembership -BWSneZ+t"AGU Membership 2008" >> ${fig[1]}
rm -f .gmt*
Continued in Part II
Disclaimer of liability
The information provided by the Earth Inversion is made available for educational purposes only.
Whilst we endeavor to keep the information up-to-date and correct. Earth Inversion makes no representations or warranties of any kind, express or implied about the completeness, accuracy, reliability, suitability or availability with respect to the website or the information, products, services or related graphics content on the website for any purpose.
UNDER NO CIRCUMSTANCE SHALL WE HAVE ANY LIABILITY TO YOU FOR ANY LOSS OR DAMAGE OF ANY KIND INCURRED AS A RESULT OF THE USE OF THE SITE OR RELIANCE ON ANY INFORMATION PROVIDED ON THE SITE. ANY RELIANCE YOU PLACED ON SUCH MATERIAL IS THEREFORE STRICTLY AT YOUR OWN RISK.
Leave a comment