Getting Started with Databricks for Big Data Analysis
Databricks is a cloud-based analytics platform built to simplify big data and AI workflows. It combines Apache Spark with collaborative notebooks, managed clusters, and a unified workspace so teams can process large datasets efficiently. This guide walks through the basic steps to start analyzing data in Databricks.
The one mental model
Databricks is Spark you don’t have to install. You write code in a notebook; a managed cluster (Spark) executes it across many machines; your data lives in cloud storage and loads into a DataFrame you analyze and chart — all in one browser workspace.
notebook → cluster (Spark) → DataFrame → analyze & visualize.
Why Databricks for big data analysis?
Databricks helps reduce operational overhead and accelerates data workflows:
- Built-in support for Apache Spark at scale.
- Collaborative notebooks for Python, SQL, Scala, and R.
- Managed clusters with autoscaling and easy configuration.
- Integration with cloud storage and modern data pipelines.
How the pieces fit
Prerequisites
Before starting, make sure you have:
- A Databricks account — sign up for the free Databricks Free Edition, or use a full cloud workspace.
- Basic familiarity with Python and data analysis.
- A sample CSV dataset for testing.
Heads-up (2026): The classic Community Edition retired on January 1, 2026 and was replaced by Databricks Free Edition — a no-cost, serverless, quota-limited environment aimed at students and learners. If an older tutorial says “Community Edition,” use Free Edition instead. The main practical difference for this guide is compute: on Free Edition you attach to serverless compute rather than creating a classic cluster (see Step 2).
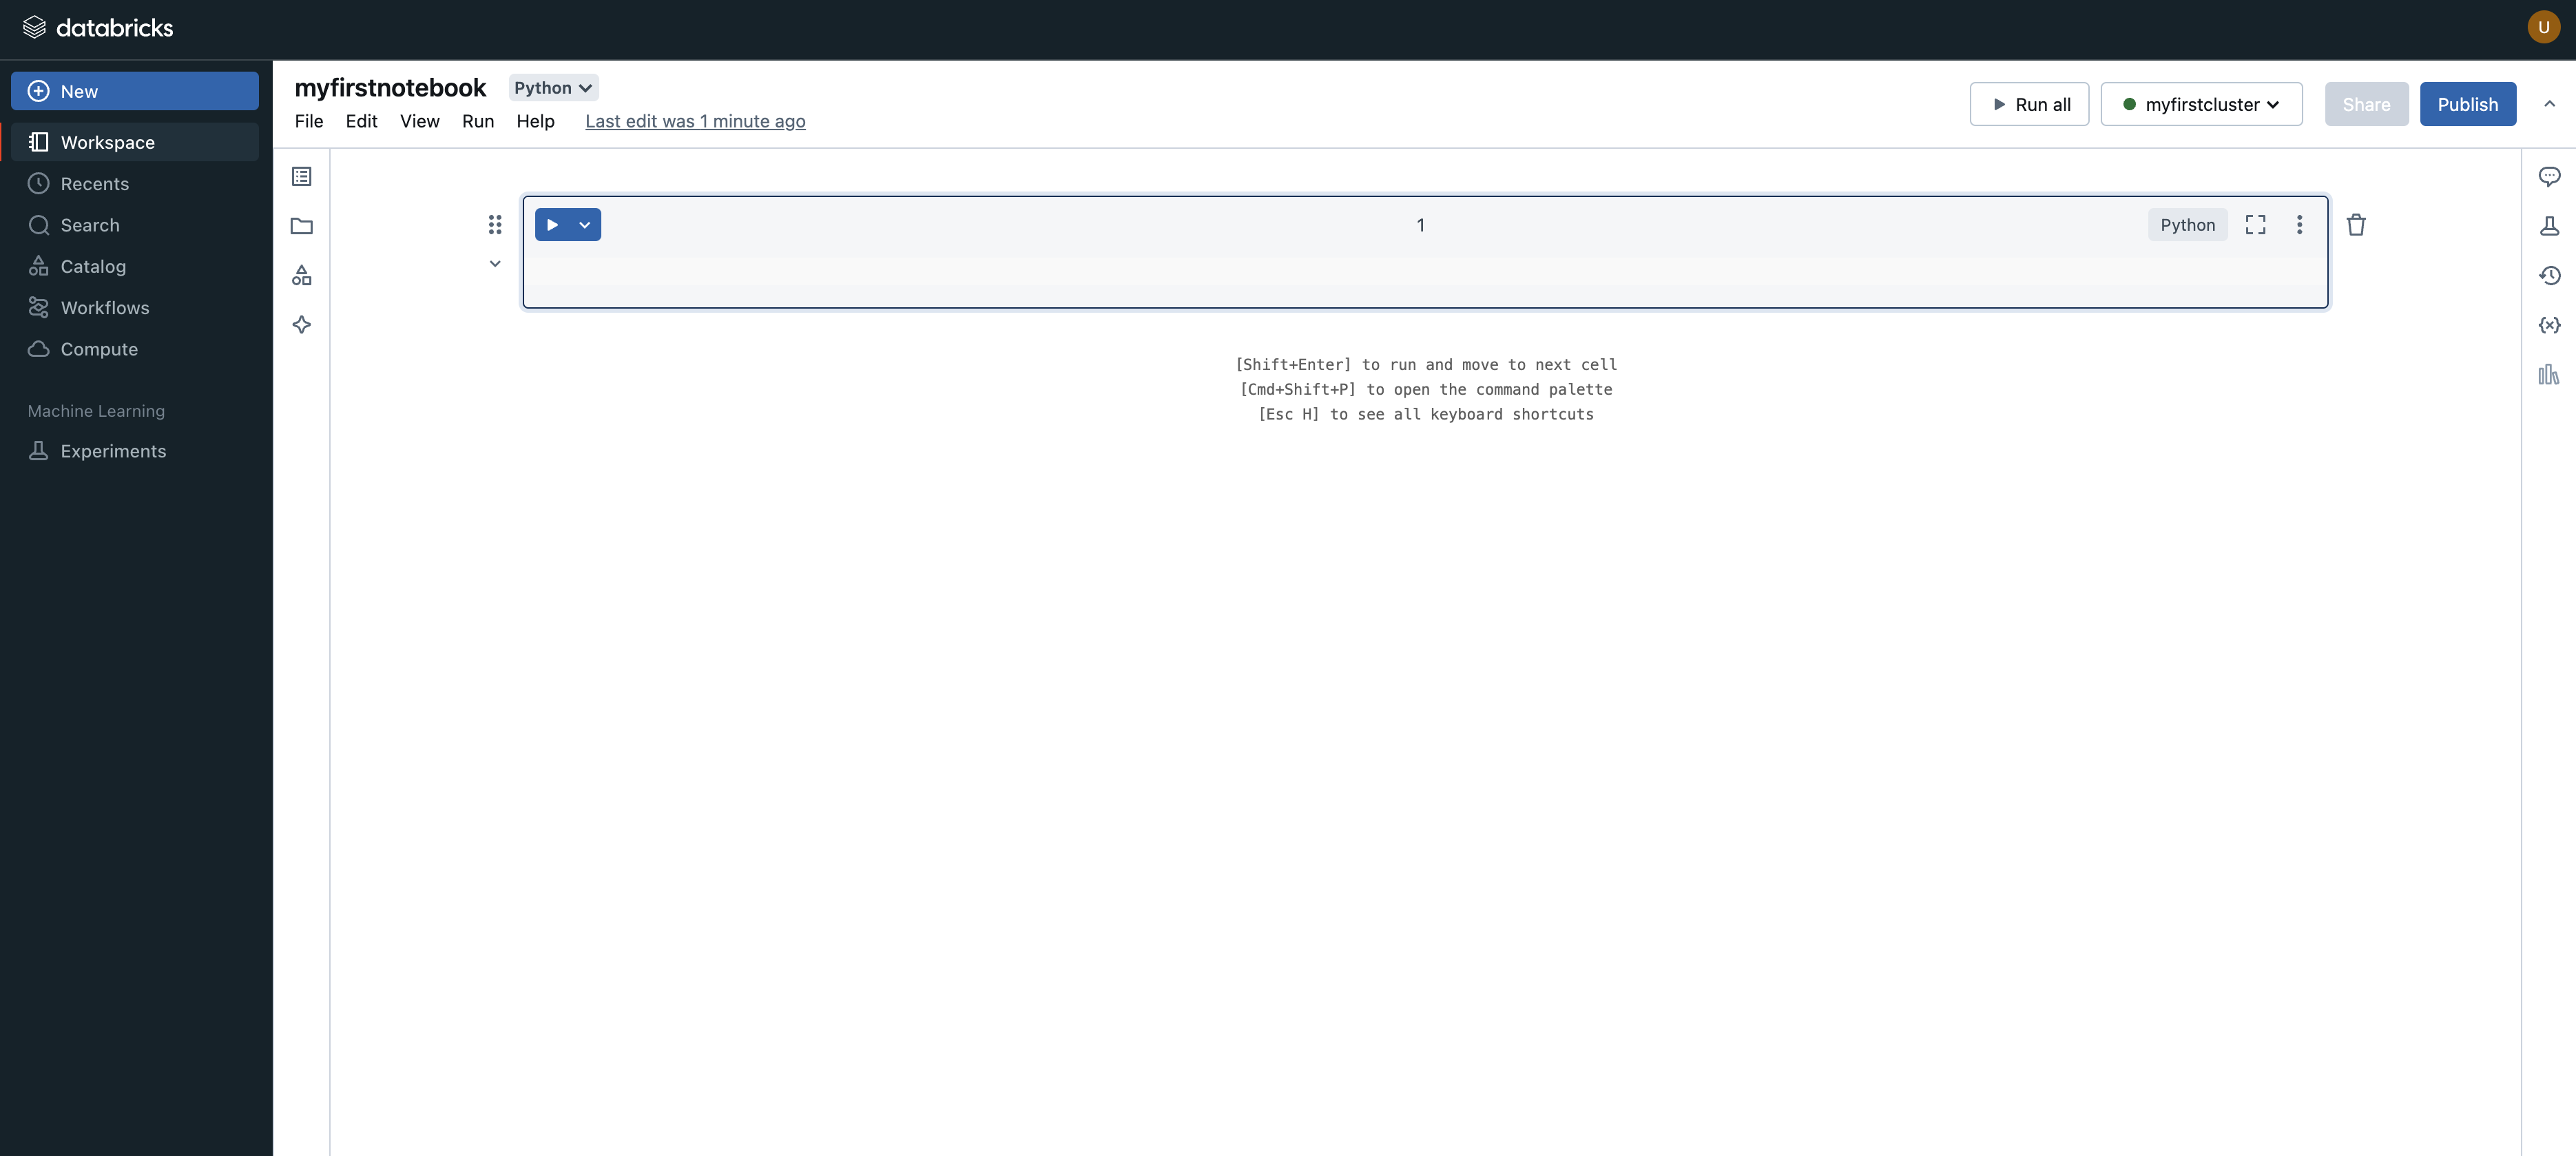
Step 1: Set up your Databricks workspace
- Create an account at Databricks (Free Edition is the quickest start).
- Log in and open your workspace.
- Create a new notebook from the workspace UI.
Step 2: Create a cluster
To run your notebooks, you need Spark compute:
- Go to the
Computesection. - Click
Create Cluster. - Choose a cluster name and runtime.
- Start the cluster and wait until it is running.
For first-time use, keep defaults to minimize setup complexity.
On Free Edition, you can skip the manual cluster. Free Edition is serverless-only, so a notebook
attaches to managed serverless compute automatically — there’s no classic cluster to size or
start. The Compute → Create Cluster flow above still applies to full (paid) cloud workspaces, where
tuning cluster size and runtime matters for cost and performance.
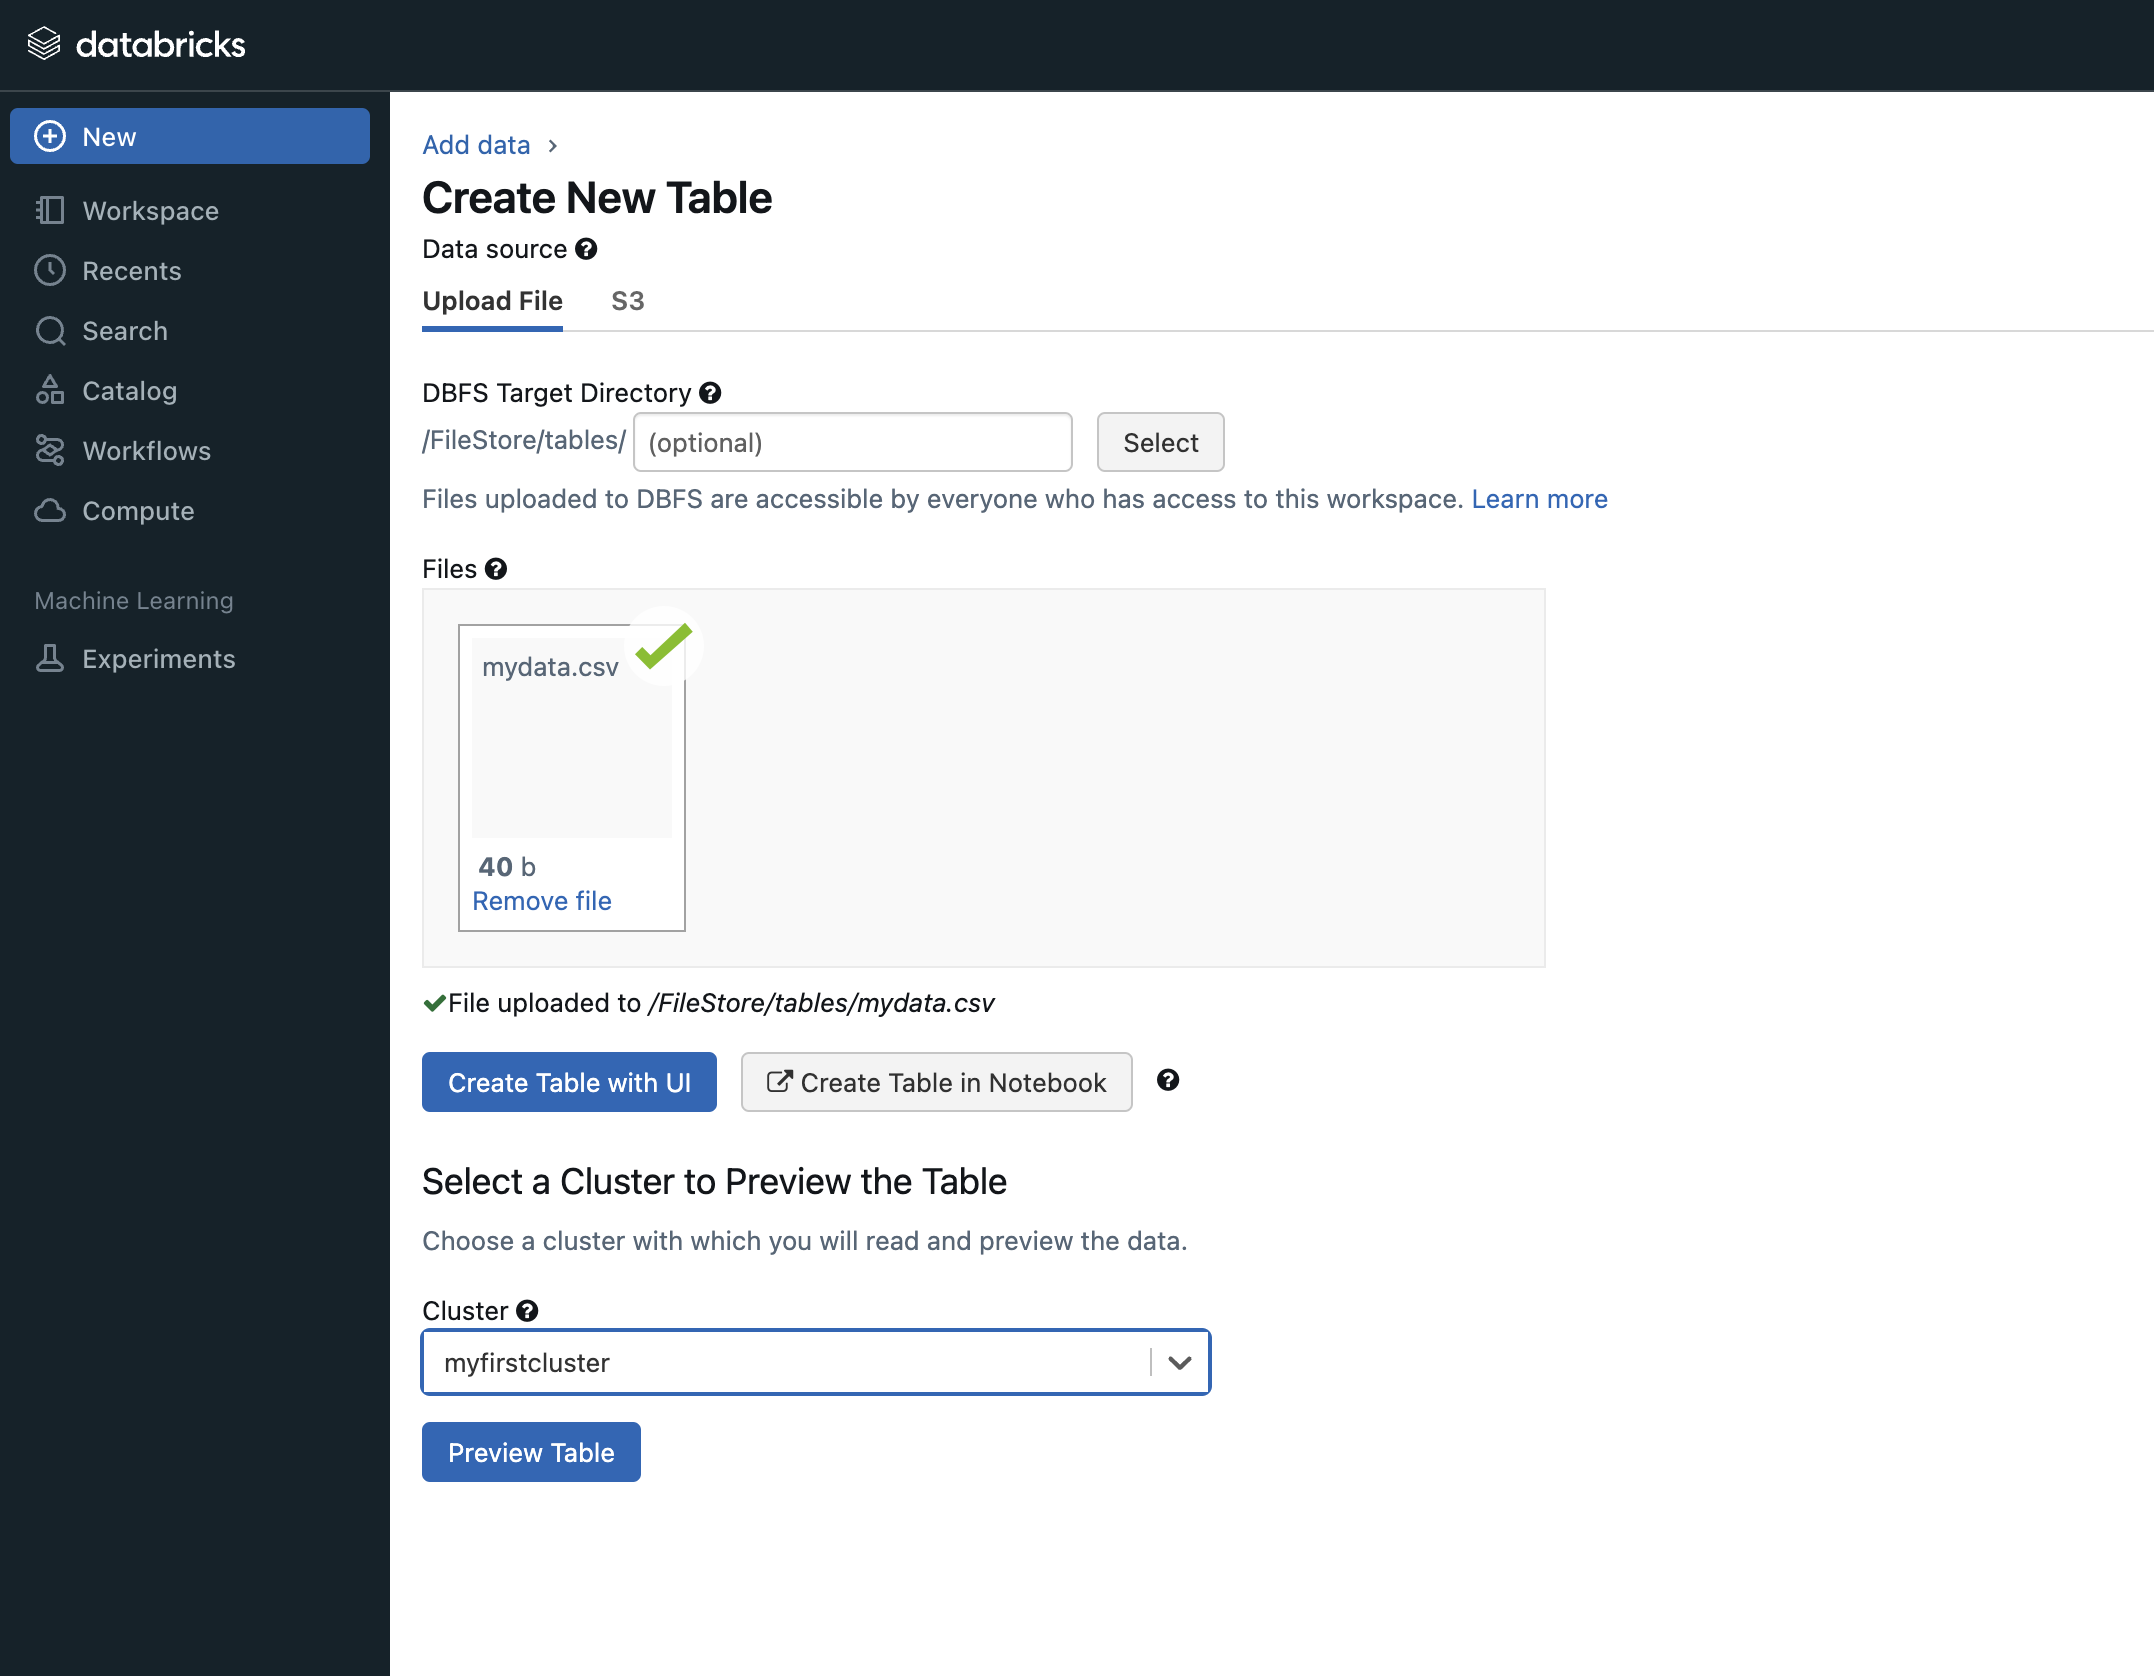
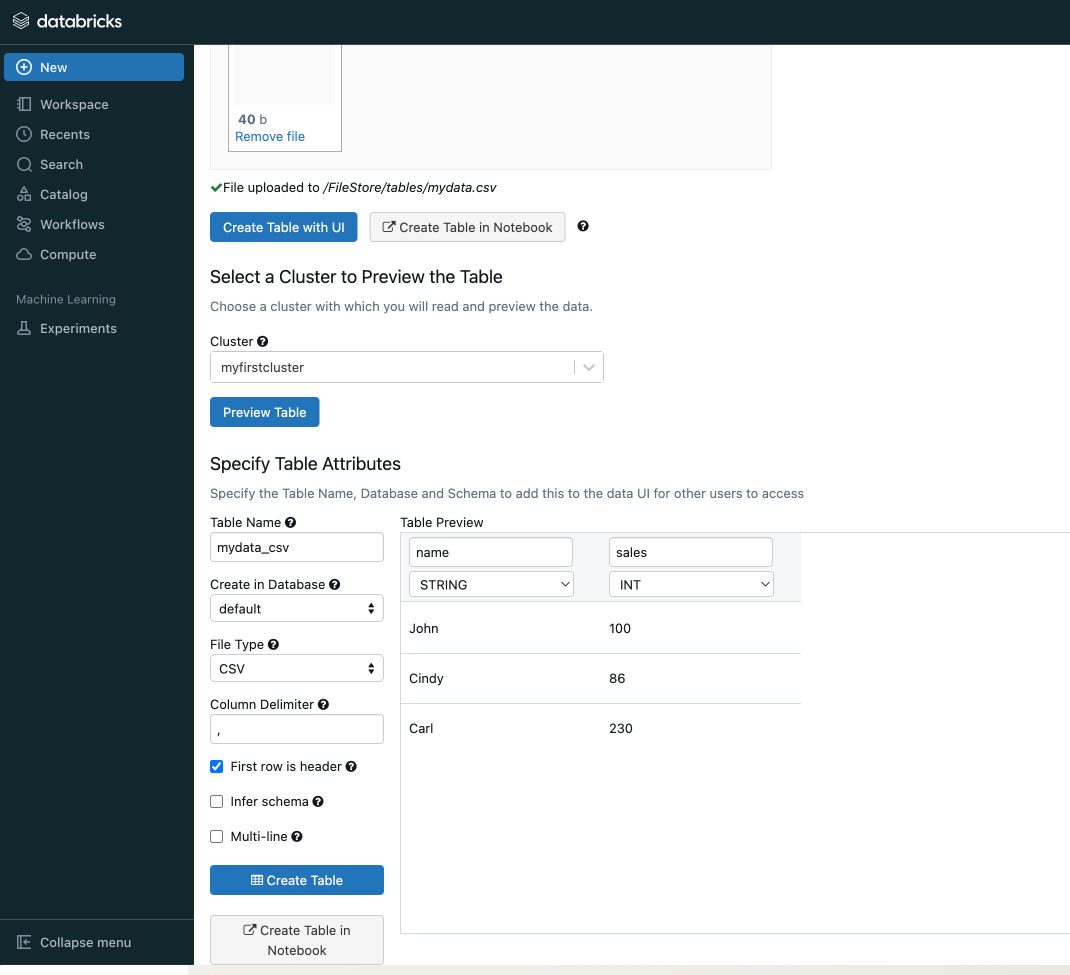
Step 3: Upload a sample dataset
- Open the
Datatab and select upload. - Add your CSV file.
- Note the storage path generated by Databricks (for example under
/dbfs/FileStore/tables/).
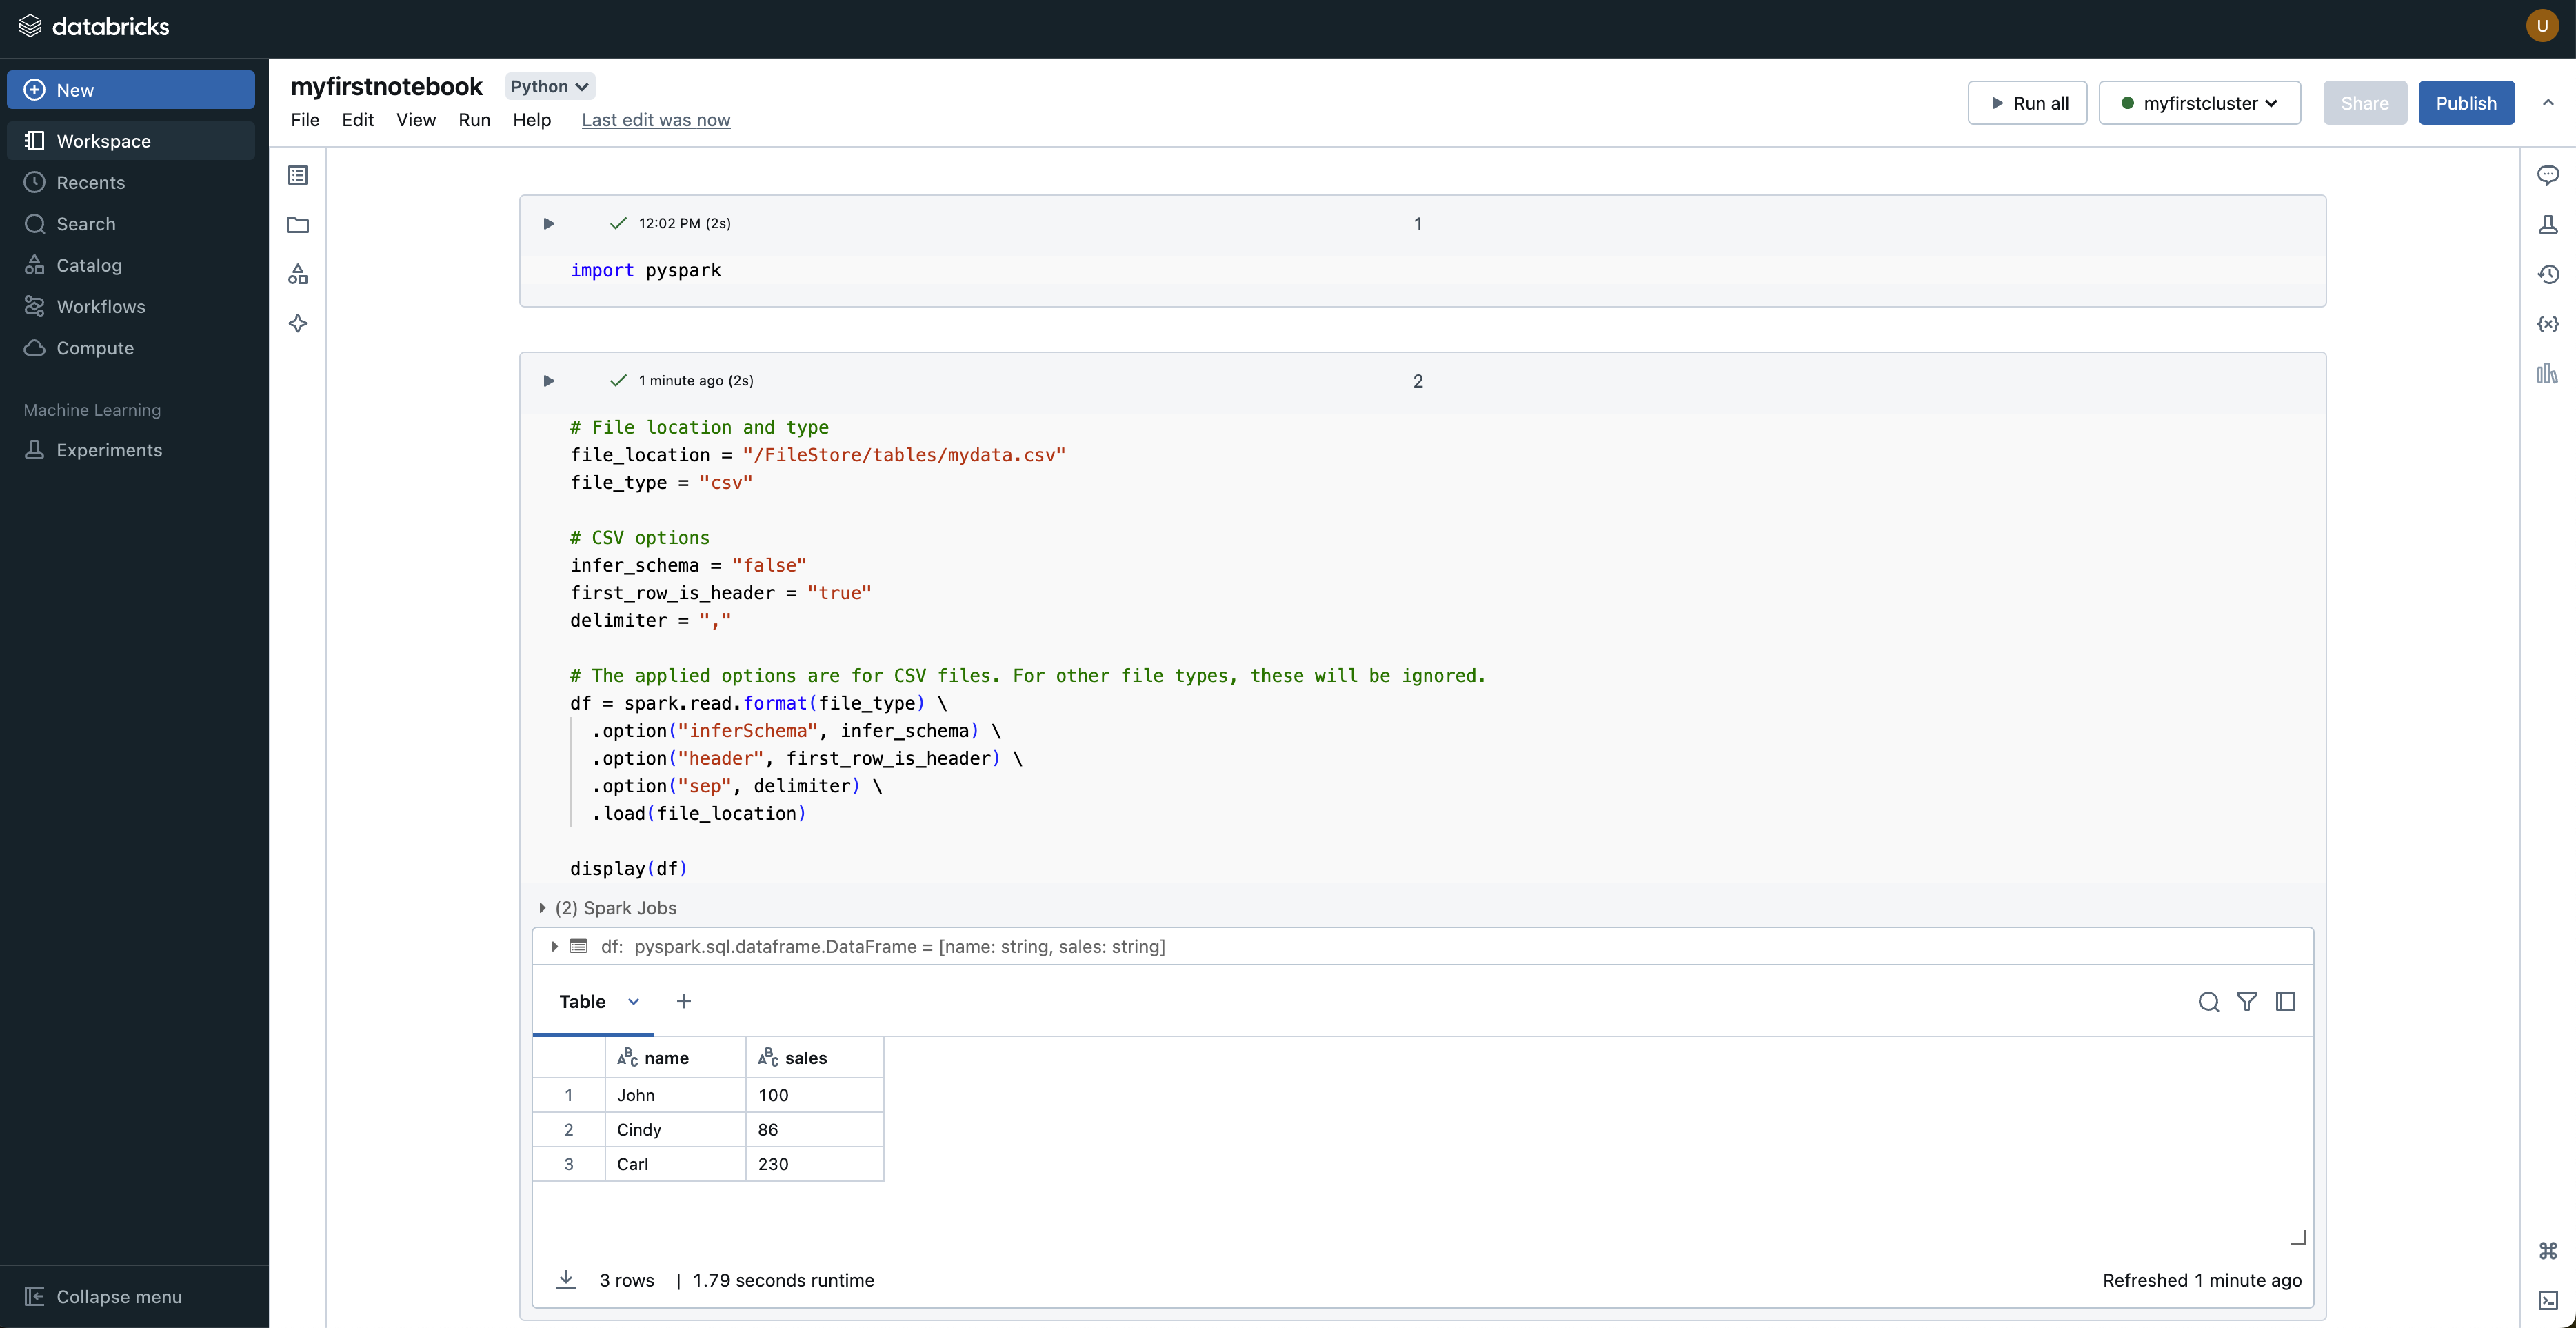
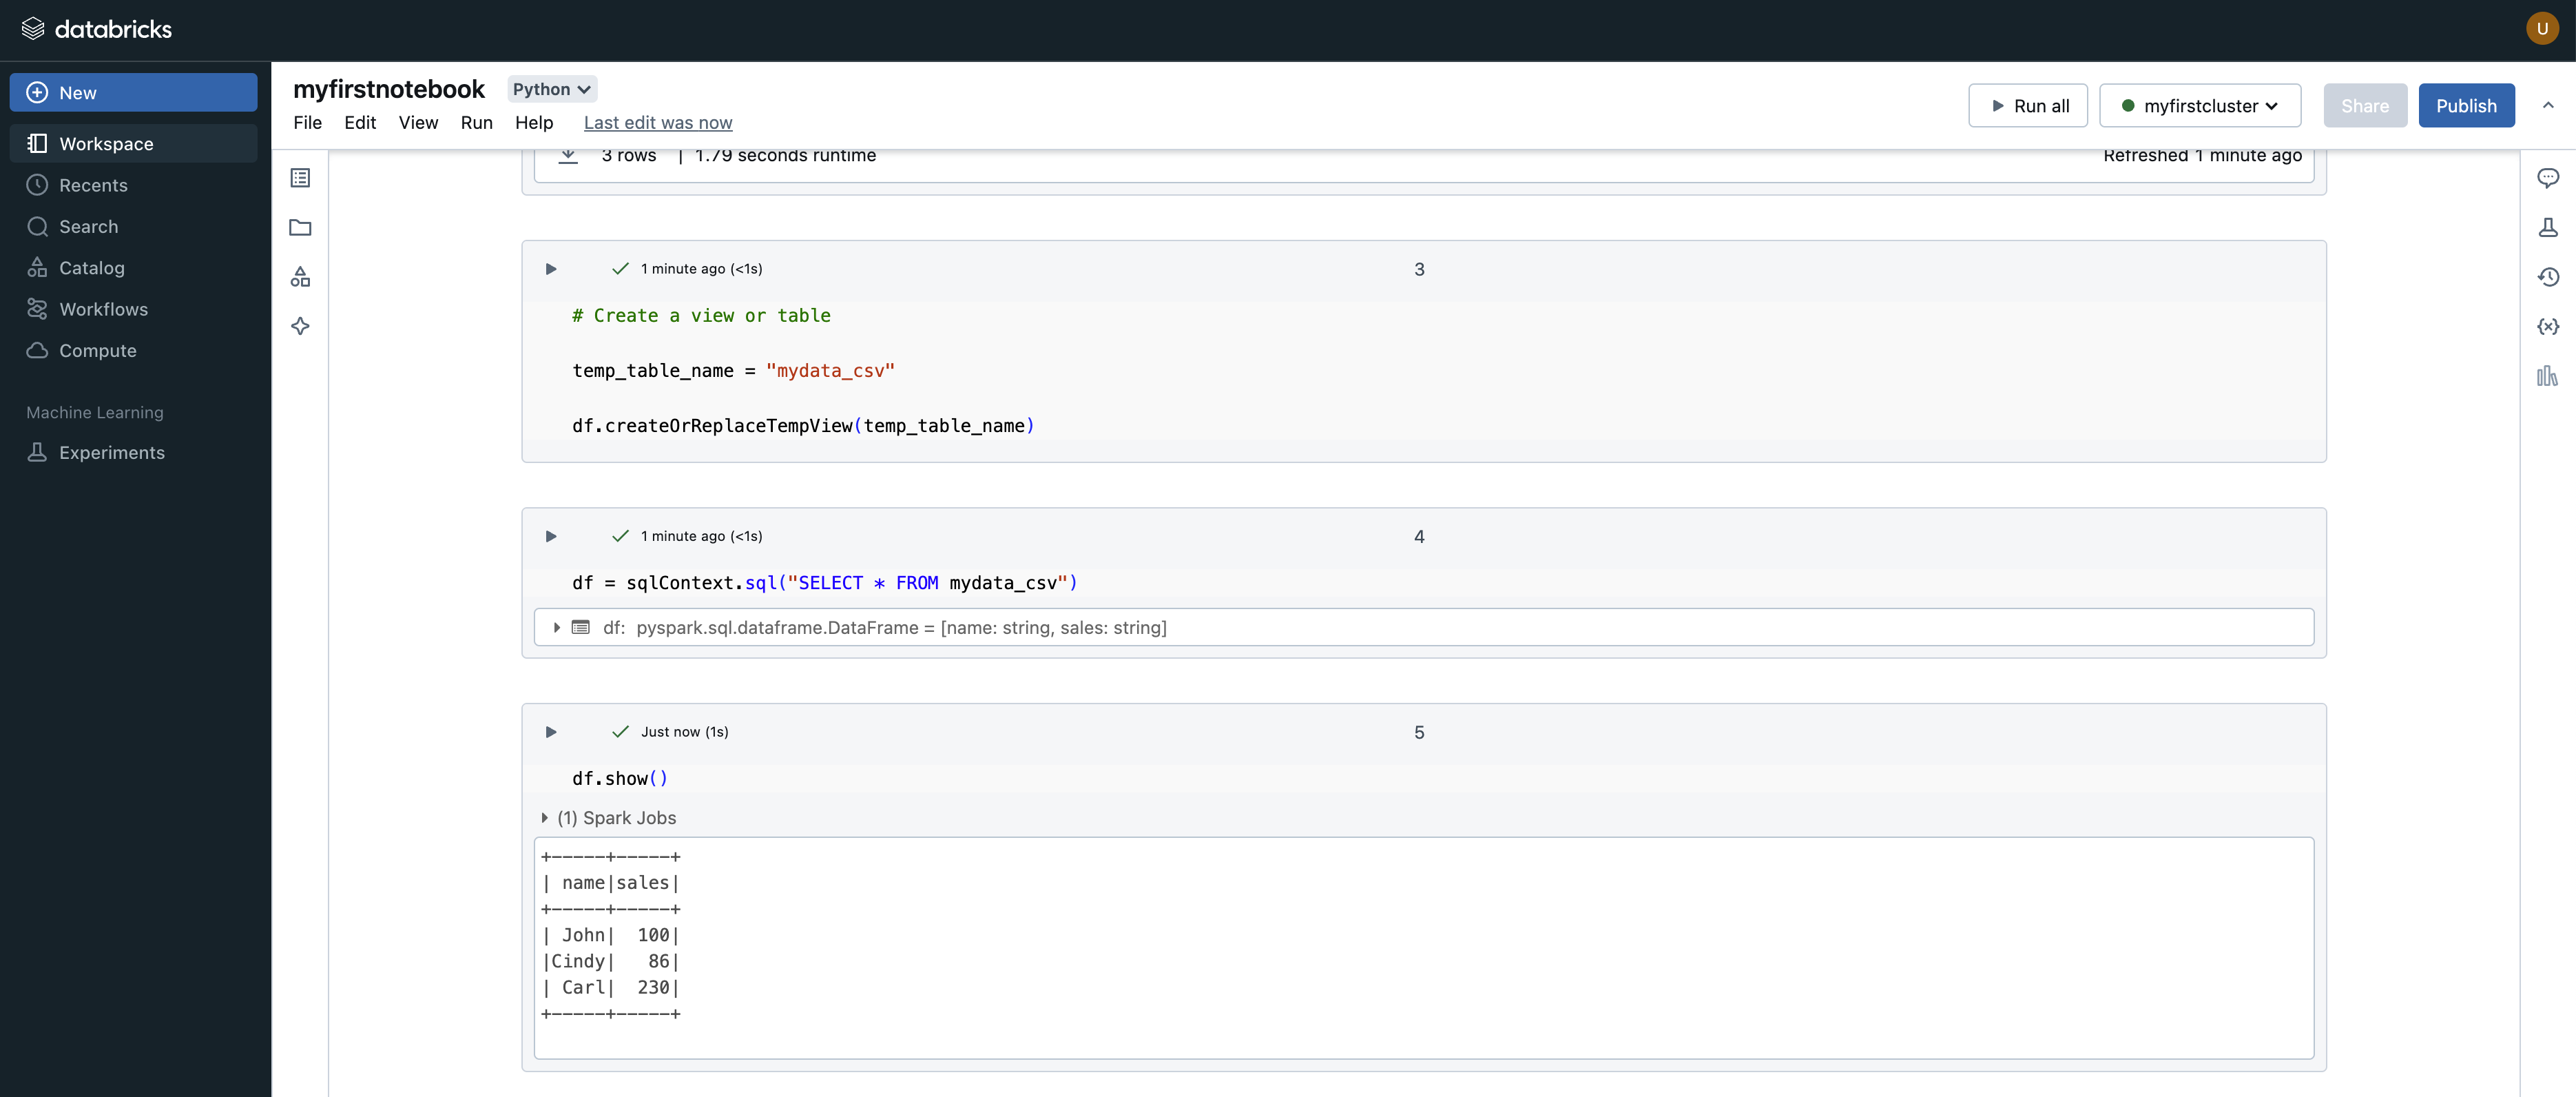
Step 4: Run your first PySpark notebook
Use the following code in a notebook cell:
from pyspark.sql import SparkSession

spark = SparkSession.builder.appName("SampleApp").getOrCreate()
df = spark.read.csv("/dbfs/FileStore/tables/sample_data.csv", header=True, inferSchema=True)
df.show()
This loads your dataset into a Spark DataFrame and previews rows.
When df.show() runs on a 500 GB file, where does the actual work happen?
Step 5: Perform basic data analysis
Try a few standard operations:
df.printSchema()
df.describe().show()
df.groupBy("category").count().show()
These commands help inspect data types, summary statistics, and simple grouped counts.
Step 6: Visualize results
Databricks notebooks support quick visualizations:
- Run a query and keep the result in a table output.
- Use the built-in chart options to switch to bar, line, or other plots.
- Iterate quickly by adjusting code and chart settings.
Practical tips
- Start with a small cluster and scale only when needed.
- Cache frequently reused DataFrames for performance.
- Use clear notebook markdown sections for readability.
- Move repeatable logic into reusable functions or jobs.
Recap
Without scrolling up — can you name the flow? Databricks lets you:
- Write PySpark or SQL in a collaborative notebook,
- Run it on a managed Spark cluster (serverless on Free Edition) that scales to your data,
- Load CSVs from cloud storage into a DataFrame,
- Analyze and visualize with a few commands and built-in charts.
With a workspace, compute, and PySpark notebooks, you can move from raw files to insight quickly — one of the fastest ways to get productive with Spark.
Where to go next
- Sign up for Databricks Free Edition — the current no-cost path (replacing Community Edition).
- PySpark documentation — the DataFrame API used above.
- Related post here: The Impact of Cloud Computing on Geophysical and Seismological Research.
Disclaimer of liability
The information provided by the Earth Inversion is made available for educational purposes only.
Whilst we endeavor to keep the information up-to-date and correct. Earth Inversion makes no representations or warranties of any kind, express or implied about the completeness, accuracy, reliability, suitability or availability with respect to the website or the information, products, services or related graphics content on the website for any purpose.
UNDER NO CIRCUMSTANCE SHALL WE HAVE ANY LIABILITY TO YOU FOR ANY LOSS OR DAMAGE OF ANY KIND INCURRED AS A RESULT OF THE USE OF THE SITE OR RELIANCE ON ANY INFORMATION PROVIDED ON THE SITE. ANY RELIANCE YOU PLACED ON SUCH MATERIAL IS THEREFORE STRICTLY AT YOUR OWN RISK.
Leave a comment