From Code to Monitoring: FastAPI Calculator DevOps Pipeline (Complete Beginner Guide)
This project is a full DevOps learning path built around a small FastAPI calculator app. It moves from clean code and testing to CI automation and live monitoring — all in one repository — so you get the whole “commit-to-dashboard” experience without drowning in domain complexity.
Repository: fastapi-calculator-devops-pipeline

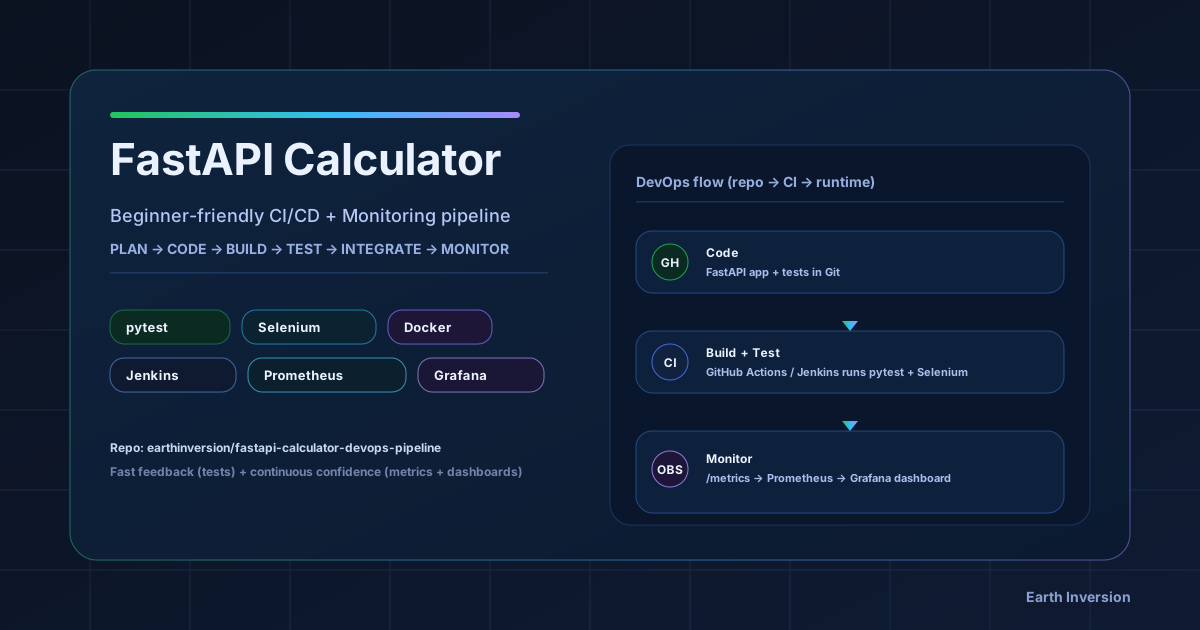
The one mental model
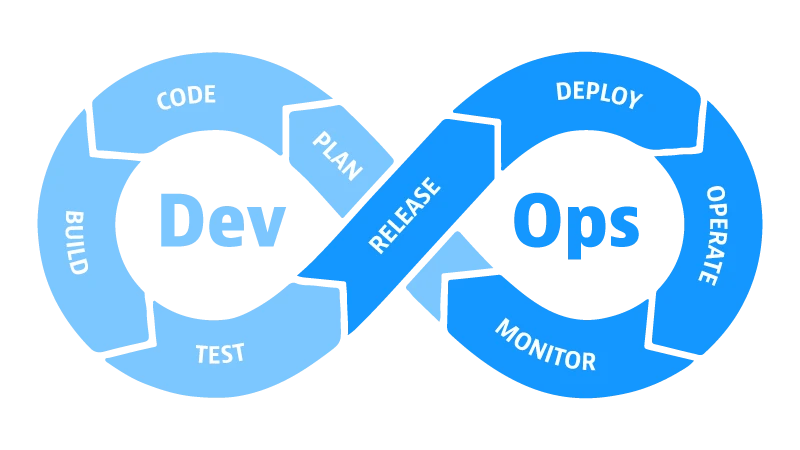
DevOps is a loop, and this repo maps one tool onto each stage of it:
PLAN → CODE (FastAPI) → BUILD (Makefile) → TEST (pytest + Selenium) → INTEGRATE (Jenkins / GitHub Actions) → MONITOR (Prometheus + Grafana)
The calculator is deliberately trivial. The point is the pipeline around it — everything you learn here transfers to a real app.
This guide is meant to be followed hands-on, not just read. By the end you should be able to:
- Build and run a simple but production-shaped FastAPI app.
- Write fast unit tests and slower end-to-end UI tests.
- Trigger CI pipelines from Git pushes.
- Compare local CI (Jenkins) vs cloud CI (GitHub Actions).
- Read useful metrics and dashboards instead of guessing app health.
Why a calculator for DevOps practice?
This project uses a calculator app because:
- The logic is simple and easy to verify.
- The UI is small, so Selenium tests stay manageable.
- The focus stays on pipeline and monitoring concepts instead of domain complexity.
- It still covers the full workflow from code to observability.
This project maps directly to:
PLAN → CODE → BUILD → TEST → INTEGRATE → MONITOR
Quick learning path (if you only have 30–45 minutes)
Use this order:
make installmake runmake test-unitmake testmake monitor- Open Grafana and watch live metrics while using the app
This gives a complete “commit-to-dashboard” experience in one session.
Complete project structure
fastapi-calculator-devops-pipeline/
├── src/
│   ├── calculator.py
│   └── app.py
├── templates/
│   └── index.html
├── tests/
│   ├── test_calculator.py
│   └── test_selenium.py
├── monitoring/
│   ├── prometheus.yml
│   └── grafana/
│       └── provisioning/
│           ├── datasources/
│           │   └── prometheus.yml
│           └── dashboards/
│               ├── dashboard.yml
│               └── calculator.json
├── .github/workflows/ci.yml
├── Dockerfile
├── docker-compose.yml
├── Jenkinsfile
├── Makefile
├── requirements.txt
└── README.md
Why these folders exist
src/: Application logic and FastAPI entrypoint.templates/: Server-rendered UI.tests/: Quality gates (logic + UI behavior).monitoring/: Observability setup that can run anywhere with Docker..github/+Jenkinsfile: Two CI implementations for side-by-side learning.
Prerequisites
Before running everything, make sure these dependencies are available:
- Python 3.9+ installed.
pipworking.- Docker Desktop running (for monitoring stack).
- Google Chrome + matching chromedriver (for local Selenium UI tests).
Optional but useful:
- Jenkins (for local CI).
- Homebrew (on macOS) for quick installs.
Version note (2026): Python 3.9 reached end-of-life in October 2025, so it no longer gets
security fixes. This repo’s CI still pins 3.9 for reproducibility, but for local development install
Python 3.11+. Likewise, since Selenium 4.6, the bundled Selenium Manager auto-downloads a
matching driver — so you usually don’t need to install or version-match chromedriver by hand anymore.
Quick verification commands:
python3 --version
pip --version
docker --version
chromedriver --version
Chrome version command depends on OS:
# Linux
google-chrome --version

# macOS
"/Applications/Google Chrome.app/Contents/MacOS/Google Chrome" --version
How tools map to each DevOps phase
| Phase | Tooling in this repository | Practical use |
|---|---|---|
| Plan | README + scope definition | Keep the app intentionally simple and focus on workflow |
| Code | Git + FastAPI source | Implement calculator logic and web routes |
| Build | Makefile + pip | Install dependencies and standardize commands |
| Test | pytest + Selenium | Validate logic first, then verify UI behavior |
| Integrate | Jenkins + GitHub Actions | Automate checks on code changes |
| Monitor | Prometheus + Grafana | Observe request rate, latency, and error behavior live |
Step 1: Clone and install dependencies
git clone https://github.com/earthinversion/fastapi-calculator-devops-pipeline.git
cd fastapi-calculator-devops-pipeline
python3 -m venv .venv
source .venv/bin/activate
python -m pip install --upgrade pip
pip install -r requirements.txt
A Makefile shortcut is also available:
make install
Dependencies in this project:
fastapifor the web framework.uvicorn[standard]as ASGI server.python-multipartfor parsing HTML form inputs.jinja2for rendering templates.prometheus-fastapi-instrumentatorfor/metrics.pytestfor unit and test orchestration.seleniumfor browser-based UI testing.
If installation fails, check that your virtual environment is active before running pip install.
Git workflow for this project
CI is centered around Git events, because git push starts automation.
git init
git add .
git commit -m "Initial commit"
For day-to-day updates, short feature branches work well:
git checkout -b feature/modulo
# edit code
git add .
git commit -m "Add modulo operation"
git push -u origin feature/modulo
Then open a pull request and let CI validate before merge. This small discipline helps avoid environment-specific surprises.
Step 2: Understand the application code
src/calculator.py (core logic)
This file keeps pure math logic:
add(a, b)subtract(a, b)multiply(a, b)divide(a, b)withValueError("Cannot divide by zero")for zero divisor
The logic is separated from the web layer so tests can run quickly without starting a server.
src/app.py (FastAPI web layer)
This file does four main jobs:
- Creates
app = FastAPI(title="CI/CD Calculator"). - Configures Jinja templates.
- Exposes
GET /andPOST /routes. - Enables Prometheus metrics automatically with:
Instrumentator().instrument(app).expose(app)
That one line exposes /metrics for observability.
Request flow (end-to-end)
Browser form submit
  -> FastAPI POST /
  -> parse inputs + selected operation
  -> call calculator.py function
  -> render result/error in Jinja template
  -> expose request metrics at /metrics
When this flow is clear, debugging gets much easier because each layer has a clear role.
templates/index.html (UI)
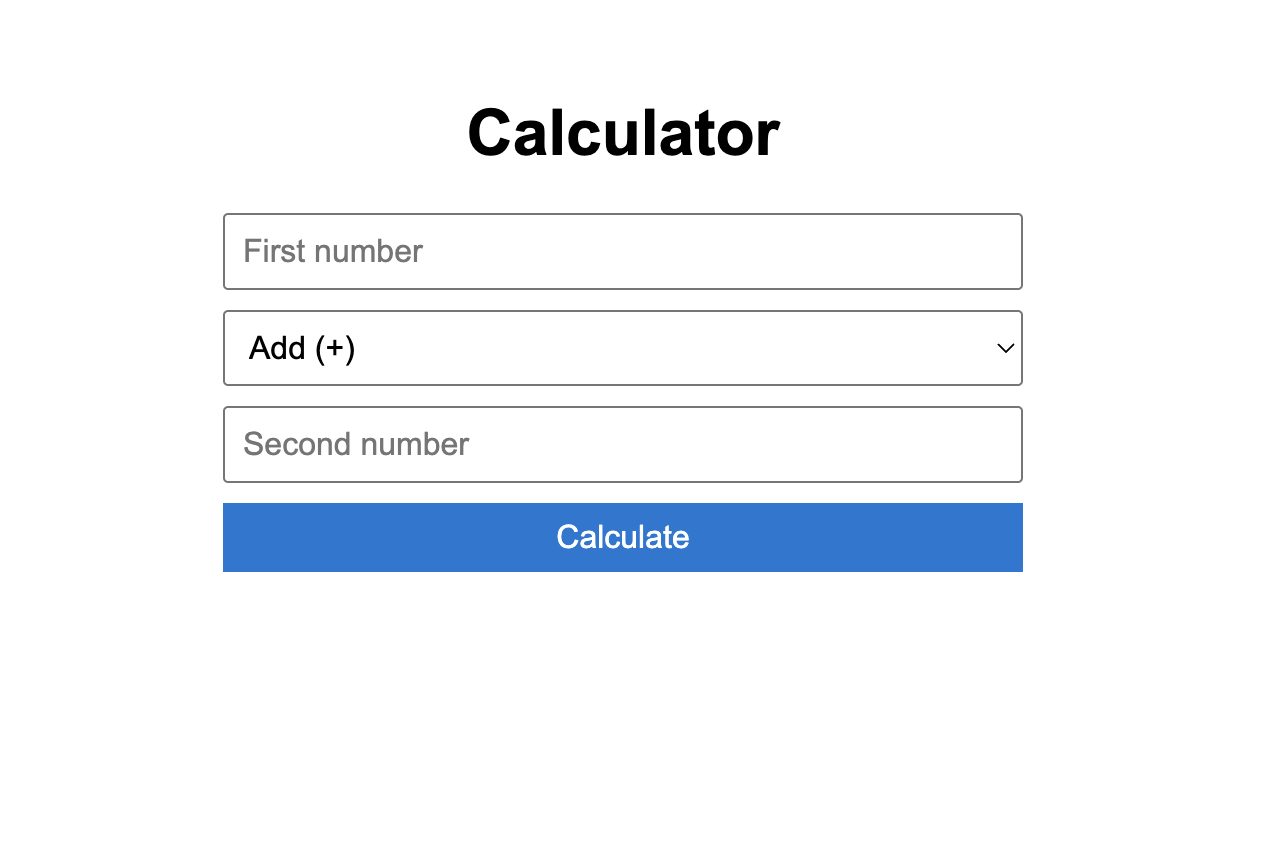
The UI is intentionally minimal:
- Input
a - Operation dropdown
- Input
b - Submit button
- Result and error blocks with IDs:
id="result"id="error"
Those IDs are important because Selenium tests read these elements directly.
Calculator app screenshot
Step 3: Run the app locally
make run
This starts:
- App UI at
http://localhost:5000 - FastAPI docs at
http://localhost:5000/docs
Equivalent raw command:
cd src && uvicorn app:app --reload --port 5000
Quick smoke test checklist:
- Open
/and verify page title. - Try
10 + 5and verify15. - Try
10 / 0and verify friendly error. - Open
/docsand confirm API docs load. - Open
/metricsand confirm Prometheus metrics appear.
Step 4: Testing strategy (fast + slow layers)
Tests are split into two layers so feedback stays fast and reliable.
Why two layers instead of only one
- Unit tests catch logic bugs in seconds.
- UI tests catch wiring and rendering issues.
- Together they reduce false confidence from “passing only one style of test.”
Why keep both a fast unit-test layer and a slow browser (UI) layer?
Layer A: unit tests (tests/test_calculator.py)
Unit tests call pure functions directly, with no browser and no network. Coverage in this file:
- Addition: positive, negative, mixed signs, floats.
- Subtraction: basic and negative result.
- Multiplication: basic and by-zero.
- Division: basic, float approximation, divide-by-zero exception.
Run:
make test-unit
Layer B: UI tests (tests/test_selenium.py)
UI tests run true end-to-end browser checks:
- Page loads and title contains
Calculator. 10 + 5gives15.10 / 0shows zero-division error.
Design details:
- A pytest fixture starts uvicorn on
127.0.0.1:5001in a background thread. - Another fixture starts headless Chrome.
- Tests use form fields and assert visible text from
#resultand#error.
Run:
make test-ui
Run all tests:
make test
Important behavior: Selenium tests are guarded with pytest.importorskip("selenium"), so they skip
gracefully if Selenium is unavailable.
A practical testing rhythm
- During coding: run
make test-unitfrequently. - Before push: run
make test. - In CI: run both to validate the full path.
This is the same pattern many production teams use.
Step 5: Build and command automation via Makefile
The Makefile provides one command per workflow task:
make installmake runmake test-unitmake test-uimake testmake monitormake monitor-downmake clean
This acts as a Python equivalent of Maven/Gradle-style task entry points. Two clear benefits: local and CI use the same commands, and new contributors don’t need to memorize long command strings.
Step 6: CI option 1 with Jenkins
A declarative Jenkinsfile defines these stages:
Code CheckoutBuildUnit TestsUI TestsIntegration Complete
Jenkins setup (macOS)
brew install jenkins-lts
brew services start jenkins-lts
Then open http://localhost:8080 and finish initial setup.
Pipeline job setup
- Create new pipeline job.
- Choose
Pipeline script from SCM. - Set SCM to
Git. - Paste repo URL.
- Set script path to
Jenkinsfile. - Build and inspect stage view.
Important Jenkins note from this repo
In the UI Tests stage, this repository currently uses:
pytest tests/test_selenium.py -v --tb=short || true
This means UI test failures do not fail the whole pipeline. This behavior keeps local Jenkins
environments (often missing browser tooling) from blocking all CI runs. For stricter CI, remove
|| true.
What does appending || true to the Selenium command do to the Jenkins stage?
Treat this as a policy choice:
- Learning/local mode: keep
|| truefor a non-blocking UI stage. - Production mode: remove it and enforce UI tests as a hard gate.
Trigger Jenkins automatically on every push
Auto-trigger can be enabled in two common ways:
- Poll SCM in Jenkins with a schedule like
* * * * *. - Configure a webhook to
http://<jenkins-host>/github-webhook/.
Polling is easiest for local learning setups. Webhooks are better for production CI responsiveness.
Step 7: CI option 2 with GitHub Actions
The repository also includes .github/workflows/ci.yml, which runs in the cloud on every:
- Push to
main - Pull request targeting
main
Workflow jobs:
build-and-unit-testui-tests(depends on unit-test job)integration-complete(depends on both jobs)
Key implementation details:
- Uses
actions/setup-python@v5with Python 3.9. - Enables pip caching for faster repeated runs.
- Uses
browser-actions/setup-chrome@v1to match Chrome and ChromeDriver in CI. - Runs Selenium UI tests headlessly on
ubuntu-latest.
Full run history is available in the repository’s Actions tab.
Reading a failed GitHub Actions run
When a workflow fails, check in this order:
- Which job failed (
build-and-unit-testvsui-tests). - First failing test and full traceback.
- Whether failure is deterministic or flaky on re-run.
- Whether failure came from code, dependency, or runner environment.
This saves time compared with reading logs top-to-bottom.
Jenkins vs GitHub Actions in this project
| Topic | Jenkins | GitHub Actions |
|---|---|---|
| Setup effort | Install and maintain Jenkins manually | Commit YAML and GitHub runs it |
| Infrastructure | Local machine or managed server | GitHub-hosted runners |
| Push integration | Polling/webhook setup needed | Built-in event trigger |
| Browser setup for UI tests | Manage Chrome/chromedriver on agents | Runner setup is mostly prepackaged |
| Best use case | Custom enterprise CI environments | Repos already hosted on GitHub |
Your repo is already on GitHub and you want CI with the least infrastructure to maintain. Which option fits?
Step 8: Monitoring with Prometheus and Grafana
This phase moves from test-time confidence to runtime visibility.
Monitoring architecture
FastAPI app (/metrics) → Prometheus scrape every 15s → Grafana dashboards
Docker Compose services
docker-compose.yml starts:
app(calculator) on host5001mapped to container5000prometheuson9090grafanaon3000
Port 5001 is used for the containerized app so local make run on 5000 remains free.
Start monitoring stack
make monitor
URLs after startup:
- App:
http://localhost:5001 - Metrics:
http://localhost:5001/metrics - Prometheus:
http://localhost:9090 - Grafana:
http://localhost:3000(admin/admin)
Stop stack:
make monitor-down
Generate traffic to make dashboards interesting
After starting the stack, generate requests so the charts become meaningful:
for i in {1..40}; do
  curl -s -X POST http://localhost:5001/ \
    -d "a=$i&b=2&operation=divide" > /dev/null
done
Then open Grafana and watch request rate and latency panels update.
Prometheus config (monitoring/prometheus.yml)
Prometheus scrapes:
- Prometheus itself (
localhost:9090) - FastAPI app service (
app:5000) at/metrics
Global scrape/evaluation interval is 15s.
Useful PromQL queries for learning
# Request rate in the last minute
rate(http_requests_total[1m])

# 95th percentile latency
histogram_quantile(0.95, rate(http_request_duration_seconds_bucket[1m]))

# Error percentage
rate(http_requests_total{status_code=~"4..|5.."}[1m])
  / rate(http_requests_total[1m]) * 100
Grafana provisioning
Everything is pre-provisioned so no manual dashboard setup is needed:
- Datasource provisioning file points Grafana to
http://prometheus:9090. - Dashboard provider loads JSON from provisioning path.
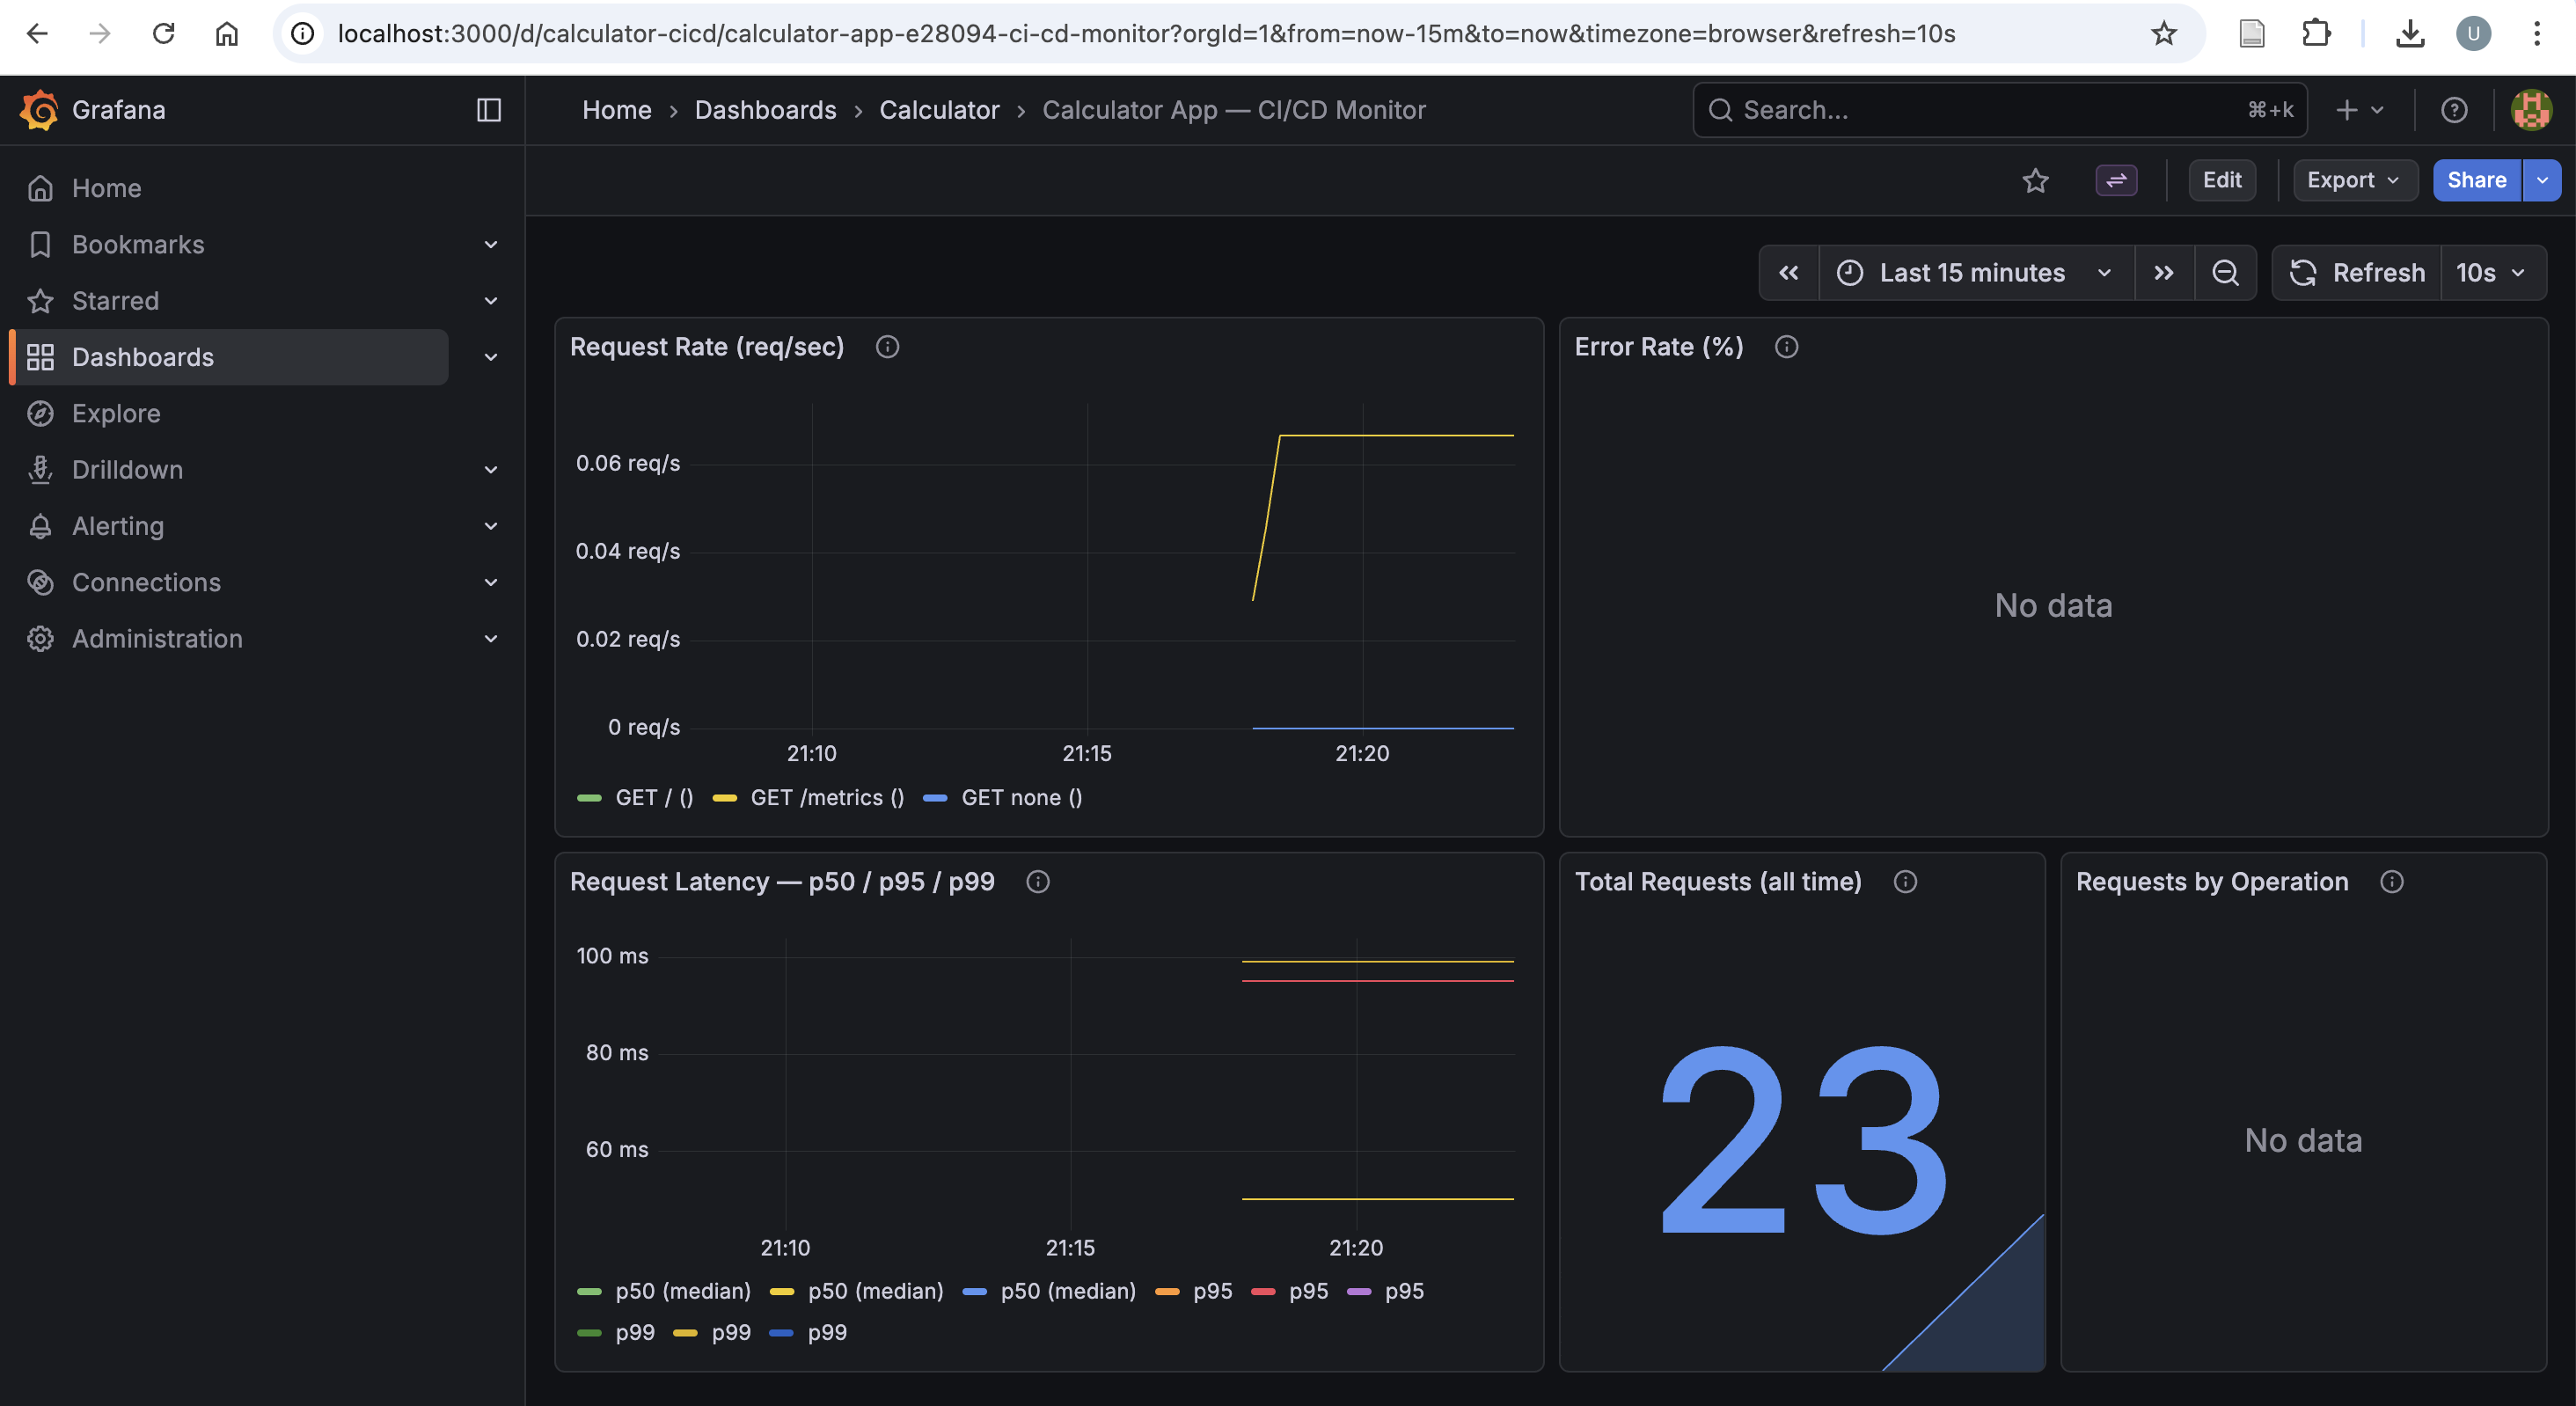
- Dashboard JSON (
calculator.json) includes five panels:- Request rate
- Error rate (%)
- Latency p50/p95/p99
- Total requests
- Requests by operation
How to read these panels in practice:
- Request rate spike + flat latency: system is healthy under load.
- Request rate spike + latency spike: potential bottleneck.
- Error-rate increase: likely bad inputs or application regression.
- Zero traffic: app might be idle or scraping path is broken.
Grafana dashboard screenshot
Common issues and fast fixes
| Symptom | Likely cause | Fast fix |
|---|---|---|
make test-ui fails with driver errors |
Chrome/ChromeDriver mismatch | Update both to matching versions |
| Jenkins UI stage unstable | Missing browser dependencies on agent | Install browser stack or keep UI stage non-blocking locally |
| No metrics in Grafana | Prometheus target down | Check http://localhost:9090/targets and app container health |
Port conflict on 5000/5001/3000/9090 |
Another service already bound | Stop conflicting process or change compose port mapping |
| Tests pass locally but fail in CI | Hidden environment dependency | Pin versions and align local/CI commands via Makefile |
End-to-end local runbook
# install deps
make install

# run app
make run

# run tests
make test-unit
make test

# run monitoring stack in docker
make monitor

# stop monitoring stack
make monitor-down

# clean caches
make clean
Practice missions, tool summary, and what's planned next
Mini practice missions — to make the learning stick, try these:
- Add
%(modulo) support end-to-end: logic, UI option, tests, and dashboard query. - Make one unit test fail intentionally and trace it through CI logs.
- Create a new Grafana panel for operation-specific error rate.
- Remove
|| truefrom the Jenkins UI stage and verify stricter gating behavior.
Tool summary
| Tool | Role in this repository |
|---|---|
| Git | Tracks source changes and triggers CI |
| FastAPI | Serves the calculator UI and routes |
| uvicorn | Runs the FastAPI app as ASGI service |
| Jinja2 | Renders HTML templates |
| pytest | Runs unit and test orchestration |
| Selenium | Automates end-to-end browser checks |
| Jenkins | Local/self-managed CI pipeline |
| GitHub Actions | Cloud CI pipeline |
| Docker + Compose | Packages and runs app + monitoring stack |
| Prometheus | Scrapes and stores metrics time series |
| Grafana | Visualizes metrics in dashboards |
What this project plans to add next
- Add a deploy stage (for example Ansible-based remote deployment).
- Replace the single-host compose setup with Kubernetes manifests.
- Add alerts (Grafana or Prometheus alert rules) for non-zero error rates and latency spikes.
- Tighten Jenkins UI test policy by failing the pipeline on Selenium failures in stable environments.
Recap
Without scrolling up — can you name the loop and its tools? This project is:
- CODE a small FastAPI calculator (logic split from the web layer),
- BUILD with a Makefile so local and CI share commands,
- TEST in two layers — fast pytest units and slower Selenium UI checks,
- INTEGRATE with either Jenkins (self-hosted) or GitHub Actions (cloud, event-triggered),
- MONITOR at runtime with Prometheus scraping
/metricsand Grafana dashboards.
Clone it and run each phase one by one rather than treating it as a black box. Small systems are the fastest way to build strong DevOps intuition.
Where to go next
- The source, to run each phase hands-on: fastapi-calculator-devops-pipeline.
- FastAPI documentation — routes, templates, and form handling.
- GitHub Actions documentation — workflow syntax and hosted runners.
- Prometheus and Grafana — metrics collection and dashboards.
Disclaimer of liability
The information provided by the Earth Inversion is made available for educational purposes only.
Whilst we endeavor to keep the information up-to-date and correct. Earth Inversion makes no representations or warranties of any kind, express or implied about the completeness, accuracy, reliability, suitability or availability with respect to the website or the information, products, services or related graphics content on the website for any purpose.
UNDER NO CIRCUMSTANCE SHALL WE HAVE ANY LIABILITY TO YOU FOR ANY LOSS OR DAMAGE OF ANY KIND INCURRED AS A RESULT OF THE USE OF THE SITE OR RELIANCE ON ANY INFORMATION PROVIDED ON THE SITE. ANY RELIANCE YOU PLACED ON SUCH MATERIAL IS THEREFORE STRICTLY AT YOUR OWN RISK.
Leave a comment