SeismoAlert: A real-time earthquake monitoring toolkit in Python (codes included)
Day-to-day earthquake monitoring usually means stitching together a fetch script, an analysis notebook, a mapping snippet, and a manual “is this rate unusual?” check. I wanted one reproducible tool instead — so I built SeismoAlert, a Python toolkit that fetches USGS earthquake data, runs statistical analysis, detects anomalies, and generates interactive maps, all from a single CLI.
Project repository: SeismoAlert on GitHub
The one mental model
SeismoAlert is four verbs behind one CLI, and the same functions are importable as a library:
fetch (get events) → analyze (Gutenberg-Richter + anomalies) → map (interactive HTML) → monitor (alert rules).
Each verb is a small, testable module — so you can run the whole pipeline from the terminal or call any piece from Python.
Motivation
I wanted a compact, reproducible workflow for the questions that come up constantly in monitoring:
- What happened in the last 24 hours above a certain magnitude?
- Is the current seismicity rate unusual compared to the recent baseline?
- Where are the events concentrated spatially?
- Did any alert-level condition trigger?
Rather than combining ad-hoc scripts and manual checks, I put all of it in one package with a clear CLI and testable modules.
What this app does
SeismoAlert has four primary workflows:
fetch: download recent events from USGSanalyze: run Gutenberg-Richter analysis and anomaly detectionmap: generate an interactive HTML mapmonitor: run one-shot monitoring with alert rules
The same functionality is available directly as a Python library.
Installation
Install from PyPI
pip install seismoalert
Install from source
git clone https://github.com/earthinversion/seismoalert.git
cd seismoalert
pip install -e .
Install for development
pip install -e ".[dev,test,docs]"
How I use it
1) Fetch recent earthquakes
# Default: last 1 day, M>=2.5
seismoalert fetch

# Custom window and threshold
seismoalert fetch --days 7 --min-magnitude 4.0 --limit 200
2) Run seismicity analysis
seismoalert analyze --days 30 --min-magnitude 1.0 --window-days 7
This step computes:
- magnitude of completeness (Mc)
- Gutenberg-Richter
aandbvalues - anomalous windows in event rate
What are those numbers? The Gutenberg-Richter law says the number of earthquakes $N$ with magnitude $\geq M$ follows
\[\log_{10} N = a - bM\]The a-value measures the overall productivity (how many events there are), and the b-value
is the slope — how quickly big events become rarer than small ones. A b-value near 1.0 is
typical for tectonic seismicity; values that drift meaningfully below 1 mean relatively more large
events. The magnitude of completeness (Mc) is the smallest magnitude above which your catalog
records essentially every event — you fit the b-value only above Mc, because below it the catalog
is missing small quakes and the slope would be biased.
Why does SeismoAlert estimate the magnitude of completeness (Mc) before fitting the b-value?
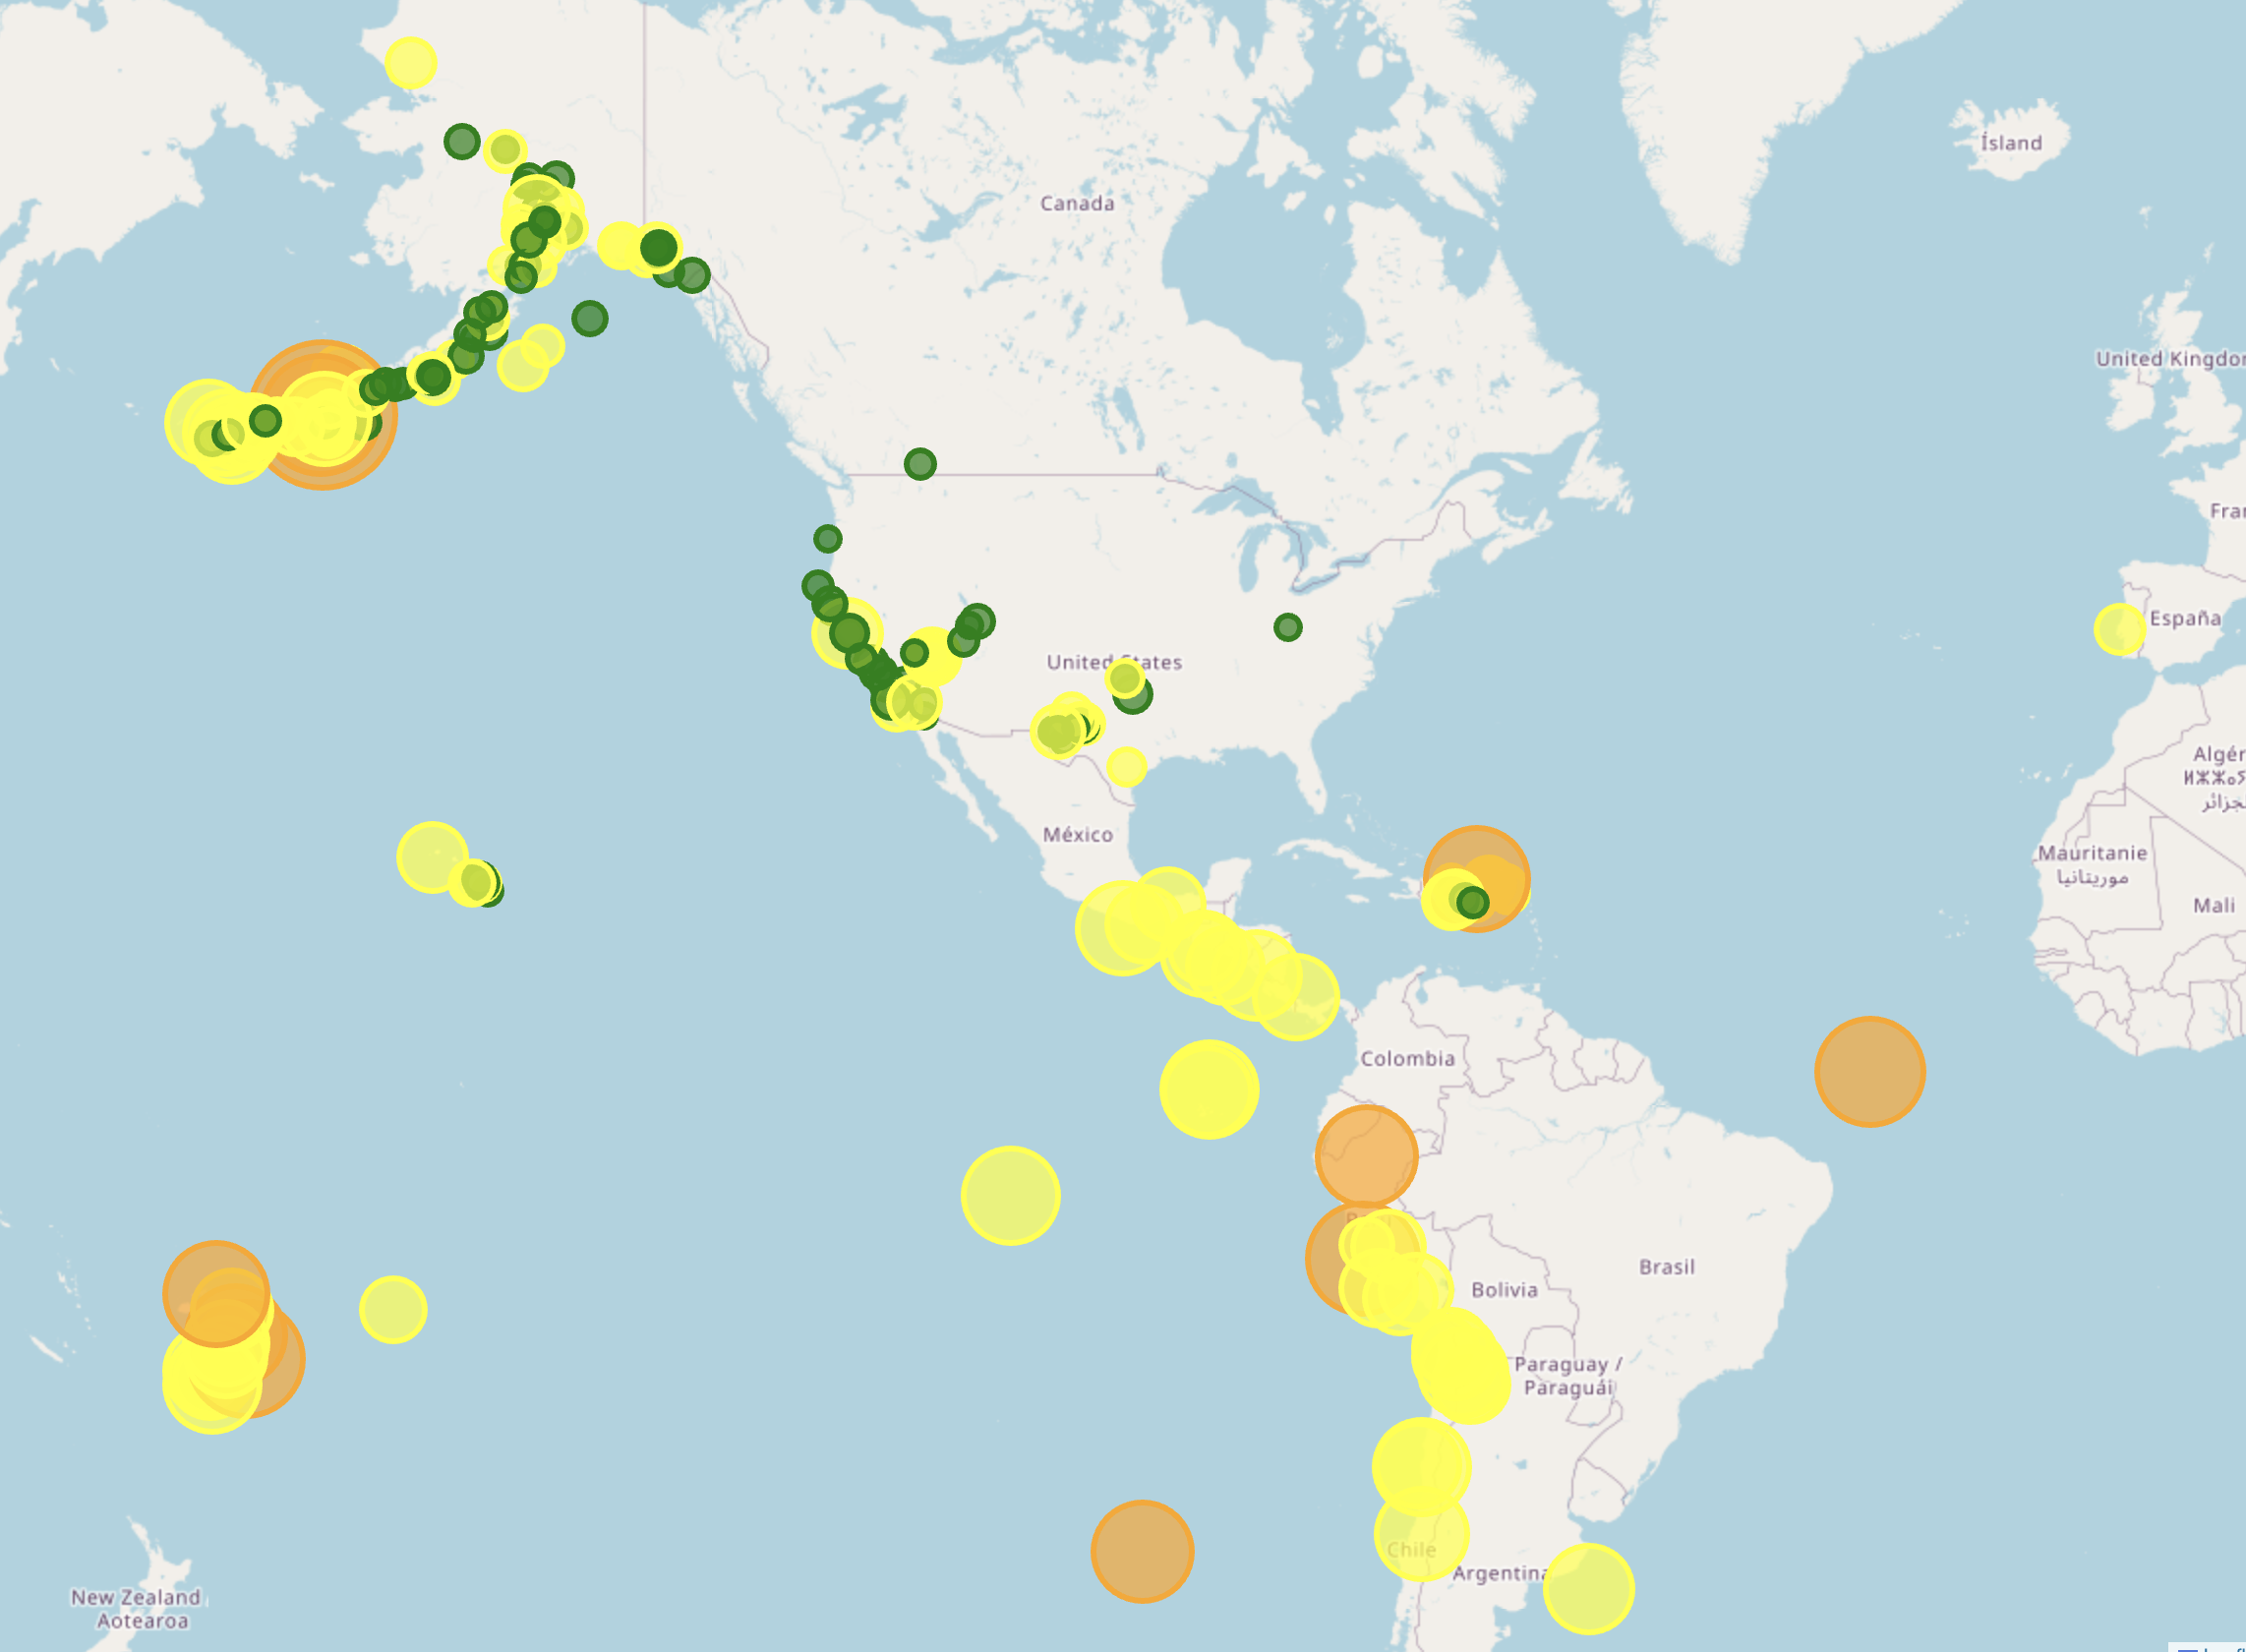
3) Generate an interactive map
seismoalert map --days 7 --min-magnitude 2.5 --output earthquakes.html
4) Run monitor and alert checks
seismoalert monitor --days 1 --min-magnitude 4.0 --alert-magnitude 6.0 --alert-count 50
Current alert rules include:
- large earthquake threshold
- high seismicity-rate threshold
Background loop with Makefile
I use the project Makefile when I want a simple operational loop. I run these from the SeismoAlert
repository root:
make install
make run
make status
make close
In this mode, make run launches a background monitor loop and writes logs to .run/seismoalert.log.
For ad hoc commands, I can use:
make fetch ARGS="--days 2 --min-magnitude 3.0"
make analyze ARGS="--days 30 --window-days 7"
make map ARGS="--output earthquakes.html"
make monitor ARGS="--alert-magnitude 6.5"
If I am not inside the repository (or if I installed only from PyPI), I run the CLI directly instead
of make:
seismoalert fetch --days 2 --min-magnitude 3.0
seismoalert analyze --days 30 --window-days 7
Here is what a fetch run looks like:
>> seismoalert fetch --days 2 --min-magnitude 3.0

Fetched 74 earthquakes (M>=3.0, last 2 day(s))
Saved 74 events to /Users/utpalkumar/Documents/datascience/seismoalert-CI-CD-Github/earthquakes.csv
Largest event: M7.1

Top events:
  M7.1  55 km NNW of Kota Belud, Malaysia  (2026-02-22 16:57 UTC)
  M6.1  93 km SW of Nikolski, Alaska  (2026-02-23 05:11 UTC)
  M6.0  south of the Fiji Islands  (2026-02-22 07:43 UTC)
  M5.8  Kuril Islands  (2026-02-22 07:25 UTC)
  M5.5  92 km SW of Nikolski, Alaska  (2026-02-23 10:02 UTC)
You want a hands-off background loop that keeps checking for alerts and writes to a log. Which command?
Using SeismoAlert as a Python library
The same building blocks are importable, so you can drop them into a larger Python workflow:
from seismoalert.client import USGSClient
from seismoalert.analyzer import gutenberg_richter

client = USGSClient()
catalog = client.fetch_earthquakes(min_magnitude=2.5)
gr = gutenberg_richter(catalog)
print(gr.b_value)
Engineering workflow, quality controls, and roadmap
I built this project with maintainability in mind:
- package layout under
src/seismoalert - unit, integration, and e2e tests
- linting and formatting workflow
- documentation built with Sphinx
- CI checks and coverage reporting
Useful project links:
- Docs: seismoalert.readthedocs.io
- Issues: GitHub Issues
How I plan to evolve this app — I see this as a strong base that can grow in several directions:
- add region-specific presets and tectonic-zone filters
- support richer alert delivery backends (webhook/email integrations beyond stubs)
- add configurable anomaly strategies for different seismic regimes
- publish scheduled summaries and trend snapshots
- add more visualization layers beyond epicenter points
I also plan to keep improving reliability by expanding test coverage around edge cases and API failure handling.
Recap
Without scrolling up — can you name the pipeline? SeismoAlert is:
fetchrecent events from USGS,analyzethem with Gutenberg-Richter (a,b, and Mc) plus event-rate anomaly detection,mapthem to an interactive HTML view,monitorwith alert rules — usable as a CLI, amakeloop, or a Python library.
The design goal was one reproducible tool with testable modules, so the same code answers a quick “what happened today?” and powers a background alerting loop.
Download and source code
I shared the source-code download in the downloads section: SeismoAlert Download Entry
Source code repository: GitHub - earthinversion/seismoalert
Where to go next
- The source, to run and extend: earthinversion/seismoalert, with full docs at seismoalert.readthedocs.io.
- USGS Earthquake Catalog / FDSN API — the data source SeismoAlert queries.
- Related post here: Monte Carlo methods and the earthquake location problem.
References
- Frequency of earthquakes in California — Gutenberg & Richter, 1944, Bulletin of the Seismological Society of America.
Disclaimer of liability
The information provided by the Earth Inversion is made available for educational purposes only.
Whilst we endeavor to keep the information up-to-date and correct. Earth Inversion makes no representations or warranties of any kind, express or implied about the completeness, accuracy, reliability, suitability or availability with respect to the website or the information, products, services or related graphics content on the website for any purpose.
UNDER NO CIRCUMSTANCE SHALL WE HAVE ANY LIABILITY TO YOU FOR ANY LOSS OR DAMAGE OF ANY KIND INCURRED AS A RESULT OF THE USE OF THE SITE OR RELIANCE ON ANY INFORMATION PROVIDED ON THE SITE. ANY RELIANCE YOU PLACED ON SUCH MATERIAL IS THEREFORE STRICTLY AT YOUR OWN RISK.
Leave a comment