A modern system monitor app in Python (codes included)
Introduction
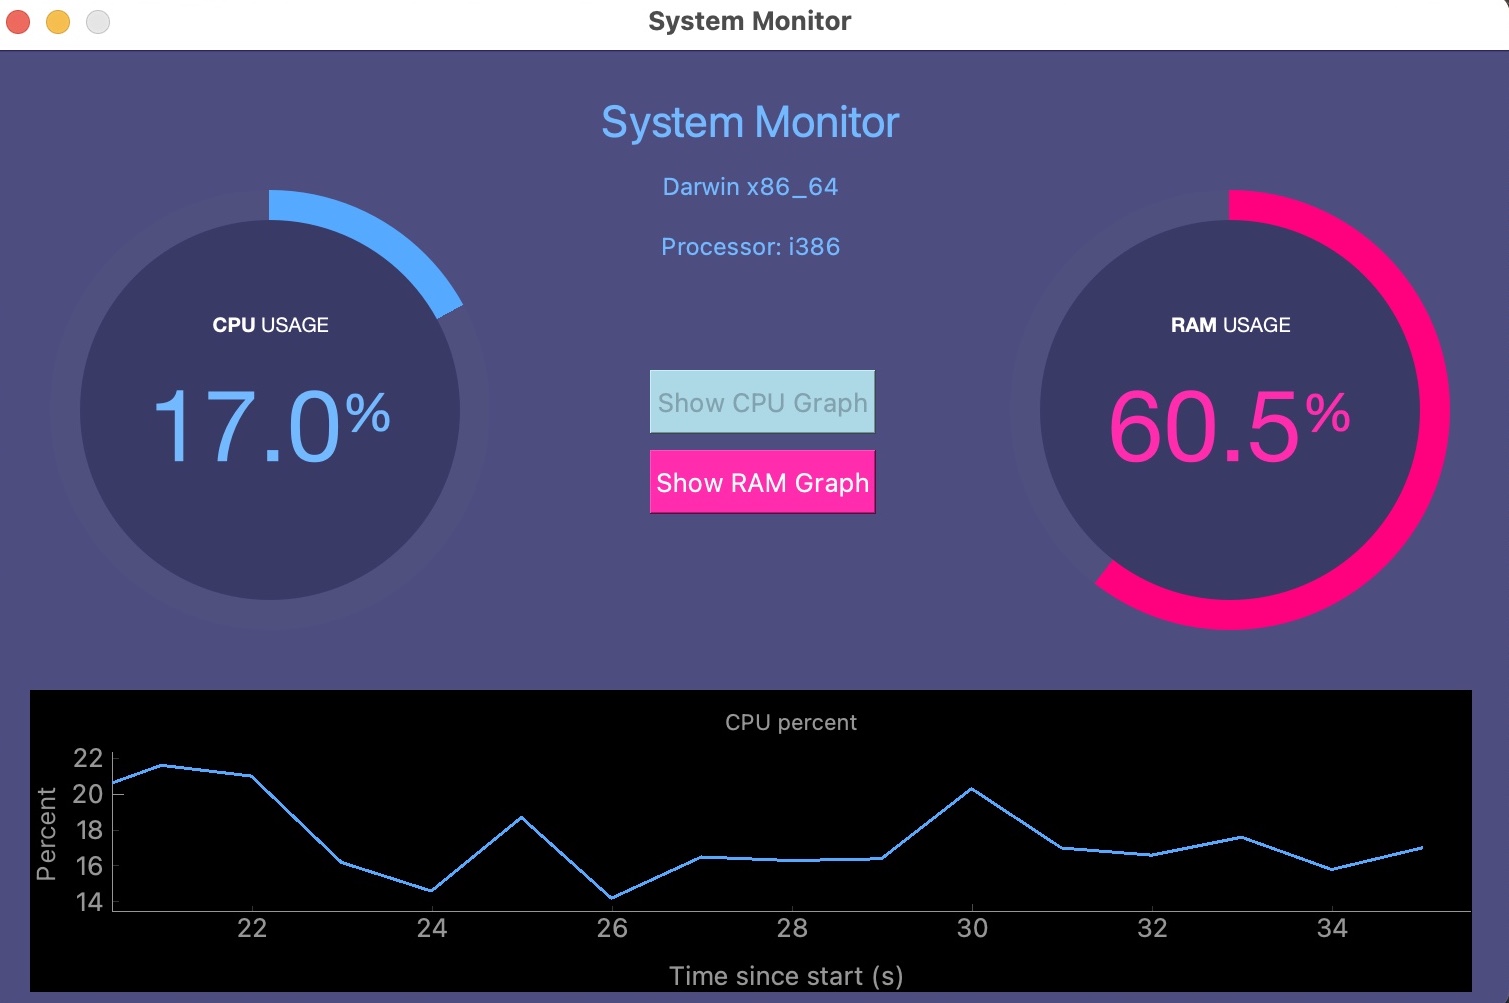
In this project, I built a system monitor desktop app with Python. I use PyQt5 for the interface, pyqtgraph for live charts, and psutil for system metrics.
I started this as a simple CPU/RAM monitor, and now I have upgraded it into a cleaner, modular app with a better UI and better developer workflow.
Repo: SystemMonitorApp
Key idea — a live monitor is just a timed poll-and-redraw loop. psutil reads the operating system’s counters (CPU, RAM, disk, network) on demand. The app puts that read on a timer: every interval it samples the current values, appends them to a short rolling history, and asks the UI to redraw. pyqtgraph draws the fast live charts and PyQt5 holds the window together. Change the tick interval and the whole app speeds up or slows down — the metrics logic never changes.
What I added in the latest update
- I reorganized the project into a proper
src/system_monitorpackage. - I split UI, services, and models for easier maintenance.
- I made the dashboard responsive and resizable.
- I added minimize/maximize support and optional start-maximized mode.
- I added a new chart mode to show both CPU and RAM in the same figure with different colors.
- I added extra real-time stats: disk usage, process count, network throughput, and uptime.
- I added optional CSV telemetry export.
- I added
Makefilecommands for install, run, status, and close. - I added tests for core service logic.
Install and run (macOS/Linux)
python -m venv .venv
source .venv/bin/activate
pip install -r requirements.txt
python systemMonitor.py
The stack is still current. psutil, pyqtgraph, and PyQt5 all install cleanly on today’s Python — psutil is on 7.x and its cpu_percent / virtual_memory / disk_usage / net_io_counters calls are unchanged. PyQt5 (5.15.x) remains maintained; if you start fresh and want the newest Qt, the successor is PyQt6 / PySide6 (Qt 6). The migration is mostly mechanical — fully-qualified enums (e.g. Qt.AlignCenter → Qt.AlignmentFlag.AlignCenter) and exec_() → exec() — and pyqtgraph supports both bindings.
Run with Makefile (macOS/Linux)
make install
make run
make status
make close
I can also pass runtime arguments from Make:
make run APP_ARGS="--start-maximized"
Run on Windows (PowerShell)
python -m venv .venv
.venv\Scripts\Activate.ps1
pip install -r requirements.txt
python systemMonitor.py
Useful runtime options
python systemMonitor.py --start-maximized
python systemMonitor.py --no-splash
python systemMonitor.py --interval-ms 1000 --history-seconds 30
python systemMonitor.py --export-csv data/metrics.csv
Current project structure
.
├── src/system_monitor/
│   ├── app.py
│   ├── constants.py
│   ├── models.py
│   ├── services/
│   └── ui/
├── tests/
├── docs/
├── main.ui
├── splash_screen.ui
└── systemMonitor.py
Download codes
I provide the Windows installer from: Downloads Page
Source code is available at: GitHub - SystemMonitorApp
Quick check: You want the dashboard to refresh twice as often. Which part do you change?
- The
psutilcalls that read the counters - The timer interval (
--interval-ms) that controls how often the app polls and redraws - The
pyqtgraphchart colors - The rolling-history length (
--history-seconds)
Recap
- A real-time monitor is a poll-and-redraw loop: a timer fires every
--interval-ms,psutilreads the OS counters, the reading joins a rolling history of--history-seconds, and the UI redraws. psutilsupplies the metrics (CPU, RAM, disk, process count, network throughput, uptime),pyqtgraphdraws the fast live charts, andPyQt5provides the window and controls.- Keeping UI, services, and models in separate modules (
src/system_monitor/) is what makes the app easy to extend — new metrics slot into the service layer without touching the UI. - Runtime flags (
--start-maximized,--no-splash,--interval-ms,--export-csv) let you reconfigure behavior without editing code, and aMakefilewraps install/run/status/close.
Where to go next
- SeismoAlert: a real-time earthquake monitoring toolkit — the same poll-and-update pattern applied to seismic data.
- macOS file indexing using Python — another practical desktop-side Python utility.
- How to create a simple Makefile — the
make install/make runworkflow this app uses.
Disclaimer of liability
The information provided by the Earth Inversion is made available for educational purposes only.
Whilst we endeavor to keep the information up-to-date and correct. Earth Inversion makes no representations or warranties of any kind, express or implied about the completeness, accuracy, reliability, suitability or availability with respect to the website or the information, products, services or related graphics content on the website for any purpose.
UNDER NO CIRCUMSTANCE SHALL WE HAVE ANY LIABILITY TO YOU FOR ANY LOSS OR DAMAGE OF ANY KIND INCURRED AS A RESULT OF THE USE OF THE SITE OR RELIANCE ON ANY INFORMATION PROVIDED ON THE SITE. ANY RELIANCE YOU PLACED ON SUCH MATERIAL IS THEREFORE STRICTLY AT YOUR OWN RISK.
Leave a comment