How to automatically enquire the availability of seismic data using Obspy
This post will see how we can retrieve the available seismic waveforms information for a given network, station, channel, and client in a given period.
Key idea — FDSN is one protocol that every data center speaks. You don’t need to know which archive holds a given station. ObsPy ships a directory of FDSN data centers (URL_MAPPINGS), and the same Client(name).get_stations(...) call works against every one of them. So the trick here is simple: loop through the data centers, run your availability query against each, and stop at the first that returns an inventory (station metadata) — then map it. Note this queries availability/metadata, not the waveforms themselves; downloading those is a separate step.
Retrieve all the clients’ list from Obspy
First, we need to retrieve the available clients from Obspy. This we can do using the obspy.clients.fdsn.header module.
from obspy.clients.fdsn.header import URL_MAPPINGS
for key in sorted(URL_MAPPINGS.keys()):
    print("{0:<11} {1}".format(key,  URL_MAPPINGS[key]))
all_clients = list(URL_MAPPINGS.keys())
all_clients.remove('IRIS')
all_clients = ['IRIS'] + all_clients
In the above code, we first retrieve the available clients from the Obspy fdsn service. This list is alphabetic, but we want to give preference to the “IRIS” client. So, I made the “IRIS” as the first element in the list.
The available list of the clients at the time of this post is:
IRIS        http://service.iris.edu
ISC         http://isc-mirror.iris.washington.edu
KNMI        http://rdsa.knmi.nl
KOERI       http://eida.koeri.boun.edu.tr
LMU         http://erde.geophysik.uni-muenchen.de
NCEDC       http://service.ncedc.org
NIEP        http://eida-sc3.infp.ro
NOA         http://eida.gein.noa.gr
ODC         http://www.orfeus-eu.org
ORFEUS      http://www.orfeus-eu.org
RASPISHAKE  http://fdsnws.raspberryshakedata.com
RESIF       http://ws.resif.fr
SCEDC       http://service.scedc.caltech.edu
TEXNET      http://rtserve.beg.utexas.edu
UIB-NORSAR  http://eida.geo.uib.no
USGS        http://earthquake.usgs.gov
USP         http://sismo.iag.usp.br
Grounded update — IRIS is now EarthScope. The list above is a 2021 snapshot; the current URL_MAPPINGS set is larger and several endpoints moved to HTTPS. Most importantly, IRIS DMC merged into the EarthScope Consortium (2023) — http://service.iris.edu now redirects to service.earthscope.org. Client("IRIS") still works for backward compatibility, but ObsPy has added an EARTHSCOPE shortcut and recommends it for new code: Client("EARTHSCOPE"). Everything else in this workflow is unchanged.
Retrieve the station information
# Define parameters
starttime = UTCDateTime("2020-05-15T00:00:00Z")
endtime = starttime+7*24*3600
net = "NC"
stn = "*"
channel = "*Z"
count = 0
success = False
for cl in all_clients:
    try:
        print(f"--> Trying for client: {cl}")
        client = Client(cl)

        inventory = client.get_stations(network=net, station=stn, channel=channel,
                                        level="response", starttime=starttime, endtime=endtime)

        print(inventory)

        inventory.write('station_info.txt', 'STATIONTXT', level='station')
        success = True
        if success:
            try:
                plot_stations()
            except:
                sys.exit()
            break
    except KeyboardInterrupt:
        sys.exit()
    except:
        print(cl, sys.exc_info())
    count += 1
The above code will try to retrieve the station information up to the “response” level from the list of clients iteratively. If it successfully obtains the information, it will break the loop and plot the stations on a map.
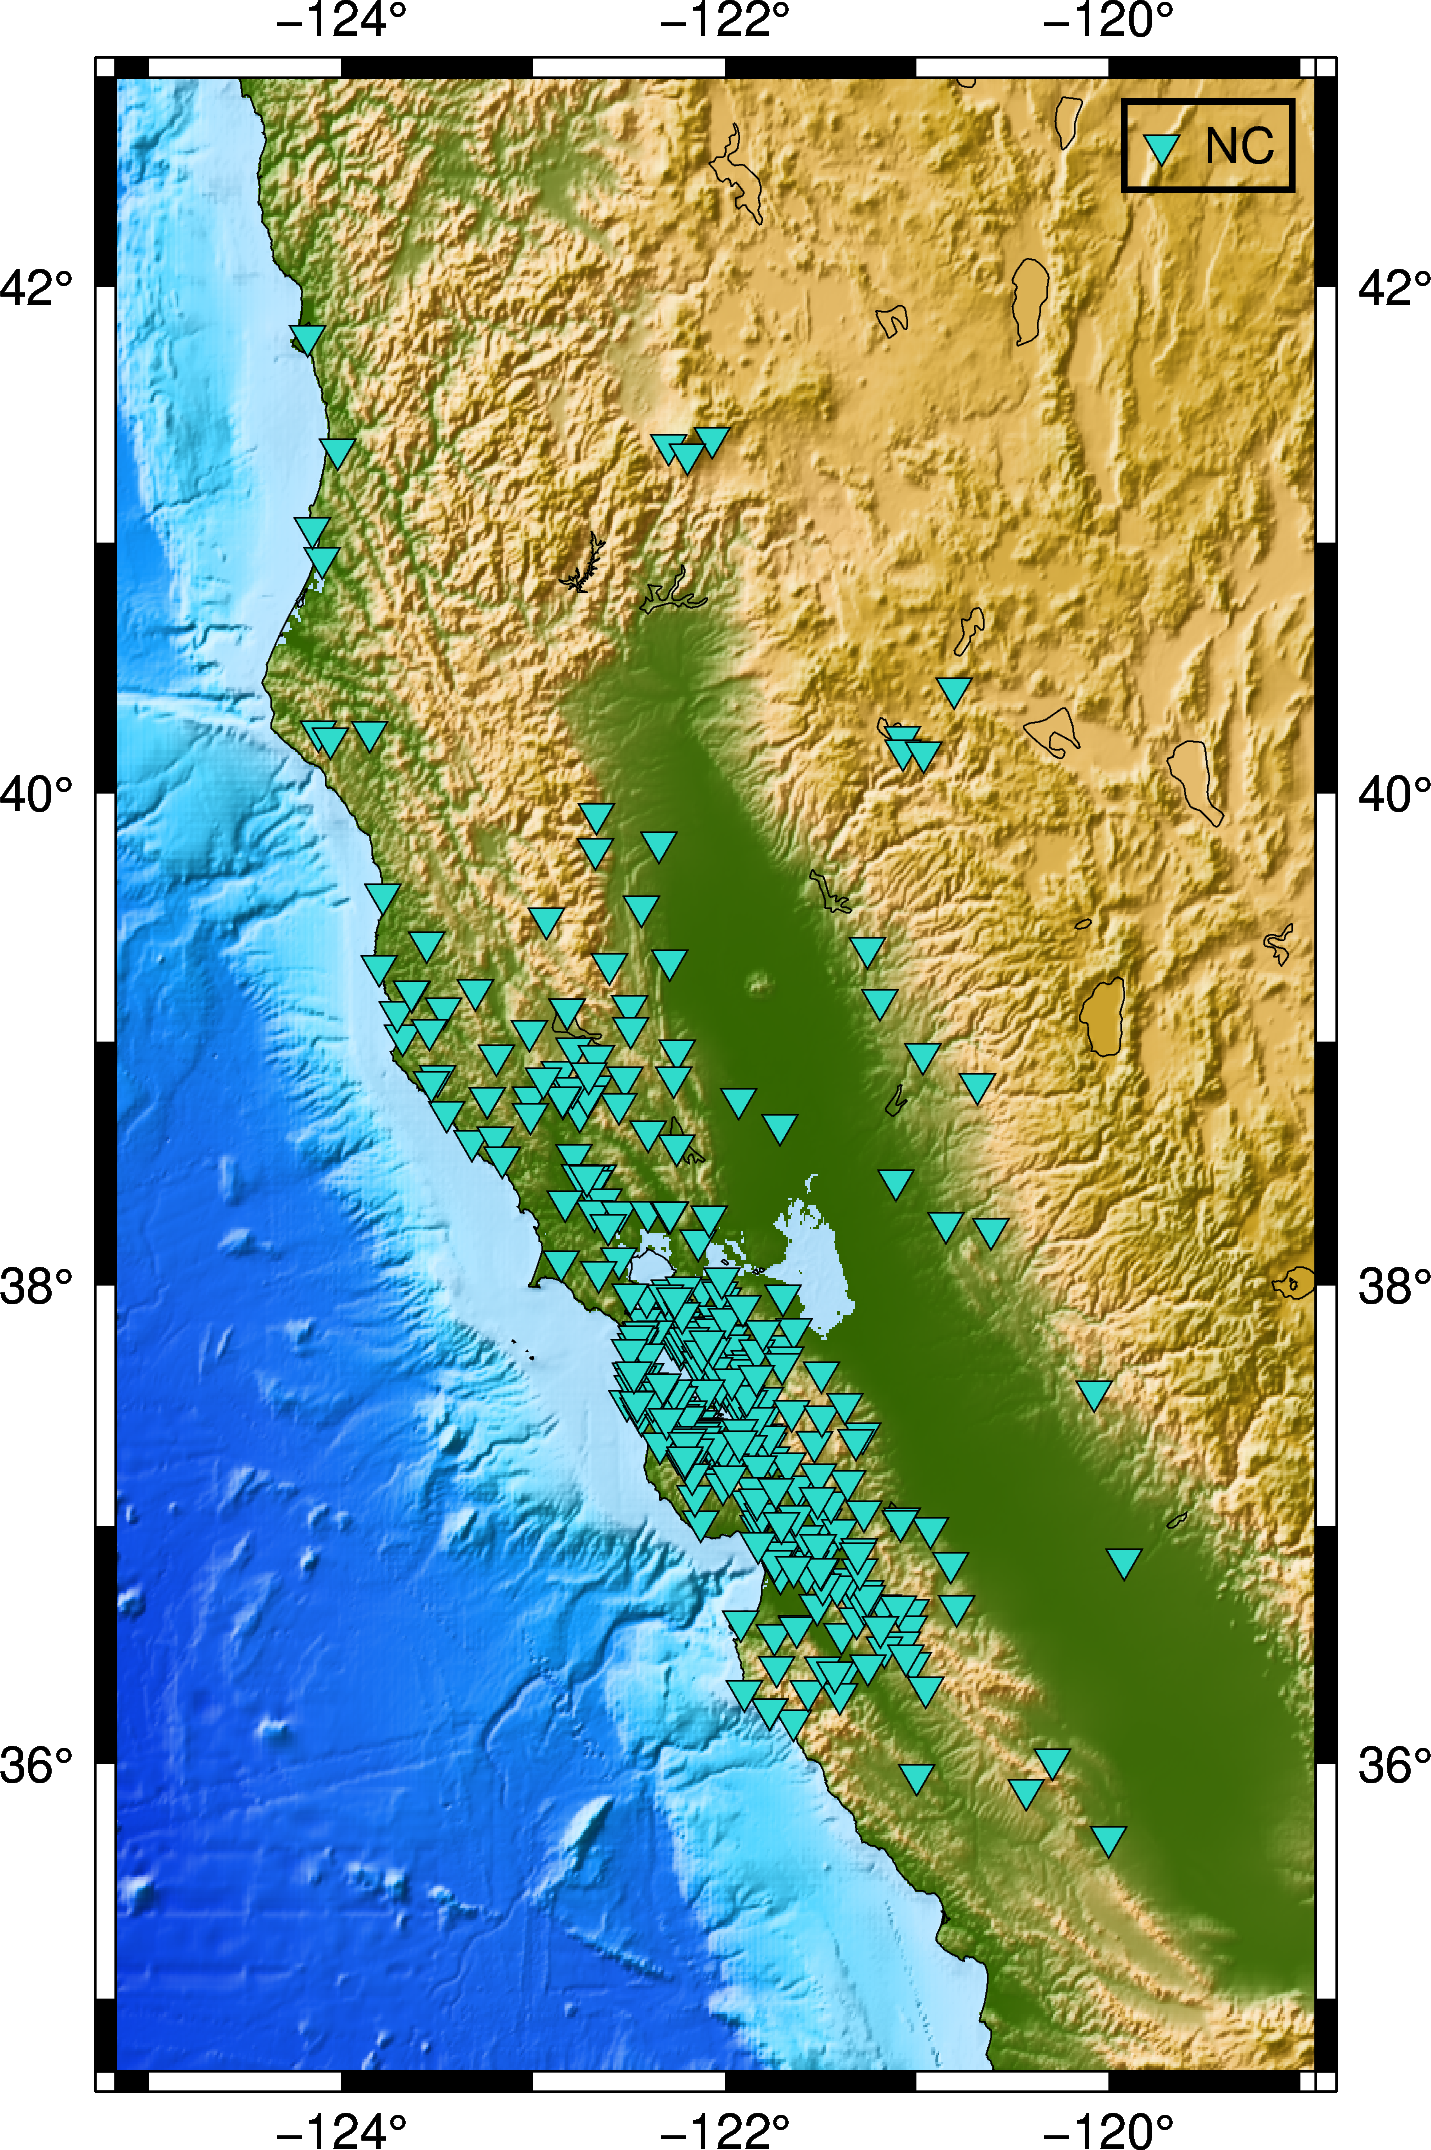
I enquired for all stations in the “NC” network and vertical component. The time range of the waveform is seven days from “2020-05-15”. All these parameters can be modified depending on the needs. The obtained station inventory will be written in the file “station_info.txt”.
Quick check: After get_stations(..., level="response") succeeds, what do you actually have?
Plot the stations
Now, we read the “station_info.txt” as a pandas dataframe and plot the stations using the “pygmt”. If multiple networks are enquired, then they will be plotted in a different color (colors are randomly chosen).
import numpy as np
import pygmt
import pandas as pd
np.random.seed(45)  # to get the same color at each run


def plot_stations():
    df = pd.read_csv('station_info.txt', delimiter='|')
    print(df.head())

    # get the list of networks
    networks = list(set(df['#Network'].tolist()))

    dfs = []
    for net in networks:
        df1 = df[df['#Network'] == net]
        dfs.append(df1)

    colorsList = []
    for i in range(len(networks)):
        colorsList.append('#%06X' % np.random.randint(0, 0xFFFFFF))

    minlon, maxlon = df['Longitude'].min()-1, df['Longitude'].max()+1
    minlat, maxlat = df['Latitude'].min()-1, df['Latitude'].max()+1

    # define etopo data file

    topo_data = "@earth_relief_30s"

    # Visualization
    fig = pygmt.Figure()
    # make color pallets
    pygmt.makecpt(
        cmap='etopo1',
        series='-8000/8000/1000',
        continuous=True
    )

    # plot high res topography
    fig.grdimage(
        grid=topo_data,
        region=[minlon, maxlon, minlat, maxlat],
        projection='M4i',
        shading=True,
        frame=True
    )

    # plot coastlines
    fig.coast(
        region=[minlon, maxlon, minlat, maxlat],
        projection='M4i',
        shorelines=True,
        frame=True
    )

    for idx, dff in enumerate(dfs):
        fig.plot(
            x=dff["Longitude"].values,
            y=dff["Latitude"].values,
            style="i10p",
            color=colorsList[idx],
            pen="black",
            label=networks[idx]
        )

    fig.legend(position="JTR+jTR+o0.2c", box=True)

    fig.savefig('station_map.png', crop=True, dpi=300)


if __name__ == '__main__':
    plot_stations()
Next, if you want to download the data, you can check my post for downloading seismic waveforms.
PyGMT renamed color to fill. In the fig.plot(...) call inside plot_stations, the color=colorsList[idx] argument was deprecated in PyGMT v0.8 and later removed — use fill=colorsList[idx] on a current PyGMT. The @earth_relief_30s remote grid and the rest are unchanged.
Complete codes
The complete code for this work can be downloaded from my github repository.
Recap
- FDSN federates the archives.
URL_MAPPINGSlists the data centers;Client(name).get_stations(...)runs the same query against any of them. - Shop around with a loop. Try each client in turn (IRIS/EARTHSCOPE first here) and break on the first success — handy when you don’t know which center holds the network.
- Availability ≠ waveforms.
get_stations(level="response")returns station metadata (an Inventory); fetch the actual data later withget_waveforms. - Two modern notes: prefer
Client("EARTHSCOPE")over"IRIS", and usefill=instead ofcolor=in PyGMT.
Where to go next
- ObsPy FDSN client docs: docs.obspy.org/packages/obspy.clients.fdsn.html
- Downloading the waveforms (companion post): Getting started with ObsPy for seismologists — Part I
- EarthScope (formerly IRIS) data services: earthscope.org
Disclaimer of liability
The information provided by the Earth Inversion is made available for educational purposes only.
Whilst we endeavor to keep the information up-to-date and correct. Earth Inversion makes no representations or warranties of any kind, express or implied about the completeness, accuracy, reliability, suitability or availability with respect to the website or the information, products, services or related graphics content on the website for any purpose.
UNDER NO CIRCUMSTANCE SHALL WE HAVE ANY LIABILITY TO YOU FOR ANY LOSS OR DAMAGE OF ANY KIND INCURRED AS A RESULT OF THE USE OF THE SITE OR RELIANCE ON ANY INFORMATION PROVIDED ON THE SITE. ANY RELIANCE YOU PLACED ON SUCH MATERIAL IS THEREFORE STRICTLY AT YOUR OWN RISK.
Leave a comment