How to plot the boundaries of the states on the basemap of the USA
Summary
The article provides a step-by-step guide on how to plot USA states on a basemap using the Python programming language. We explain the necessary packages and tools required to create a map, including matplotlib, basemap, and pandas. We also provide code snippets and examples to help readers create their own custom maps, including the option to add additional layers such as state boundaries, major highways, and cities. Overall, the article serves as a useful resource for individuals looking to visualize geographic data in Python.
Introduction
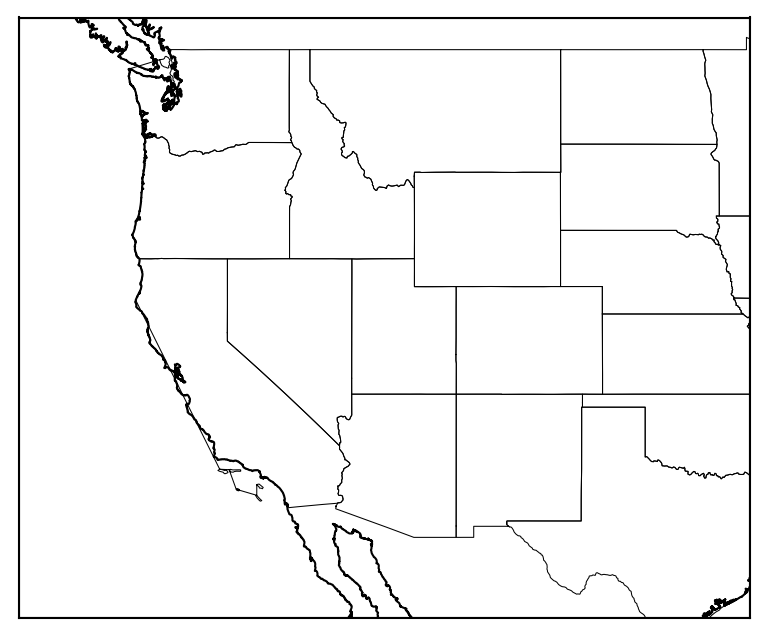
We will see how we can plot the shape data on a map, in this case, we plot particularly the states of the United States on a basemap figure. We have seen examples of how to plot the shapefile data using geopandas. Here, we will do it using the low-level tool “shapefile”.
The one mental model
A shapefile stores each state as a polygon in longitude/latitude. A screen can’t plot lon/lat
directly, so the map object projects those geographic coordinates into flat map coordinates — the
call m(lon, lat) → (x, y) — and then matplotlib draws the projected outlines.
shapefile (lon/lat polygons) → project with Basemap → draw polylines.
Basemap is deprecated. The mpl_toolkits.basemap toolkit is no longer actively developed, and
its maintainers recommend Cartopy for new work (with
GeoPandas a great option for shapefiles). The code below still runs where
Basemap is installed and the concept — read polygons, project, draw — is identical in Cartopy; only
the projection API differs. Treat this as a legacy reference.
Download the shapefile data
You can download the shapefile data for the USA states from the github repository of joncutrer/geopandas-tutorial: usa-states-census-2014.shp
To download the shapefile data:
git clone https://github.com/joncutrer/geopandas-tutorial.git
Read libraries
import numpy as np
import matplotlib.pyplot as plt
from mpl_toolkits.basemap import Basemap
import shapefile as shp
Define configuration for the plot
# configuration arguments for figure
fig_config = {'figsize': (8,4)}

## select some region of the USA
map_config = {
    'projection': 'merc',   # type of map projection
    'llcrnrlat': 28.,
    'urcrnrlat': 50.,
    'llcrnrlon': -130.,
    'urcrnrlon': -95.,
    'area_thresh': 10000,    #area threshold for coastlines
    'resolution': 'h'}       # resolution of coastline data ('c'oarse fine for global)

save_ext = 'png'
save_kwargs = {'dpi': 150, 'bbox_inches':'tight'}
Plot map
def plot_map():
    """Plot the map"""


    # figure / map setup
    fig = plt.figure(**fig_config)
    ax = fig.add_axes([0,0,0.9,1.0])
    m = Basemap(ax=ax, **map_config)
    cp = m.drawmapboundary()


    for idd in range(0,len(sf.records())):
        shape_ex = sf.shape(idd)
        x_lon = np.zeros((len(shape_ex.points),1))
        y_lat = np.zeros((len(shape_ex.points),1))
        for ip in range(len(shape_ex.points)):
            x_lon[ip] = shape_ex.points[ip][0]
            y_lat[ip] = shape_ex.points[ip][1]
        # print(shape_ex)
        xm_lon, ym_lat = m(x_lon, y_lat)
        m.plot(xm_lon, ym_lat, zorder=6, color='k', lw=0.5)

    m.drawcoastlines(zorder=6)

    fname_out="usa_states.png"
    print("output fname: ",fname_out)
    plt.savefig(fname_out, **save_kwargs)
    plt.close()
What does the line xm_lon, ym_lat = m(x_lon, y_lat) do?
Complete script
#!/usr/bin/env python
import numpy as np
import matplotlib.pyplot as plt
from mpl_toolkits.basemap import Basemap
import shapefile as shp

shp_path = 'geopandas-tutorial/data/usa-states-census-2014.shp'
sf = shp.Reader(shp_path)
print(len(sf.records()))


########################################################################
# config

# configuration arguments for figure
fig_config = {'figsize': (8,4)}

map_config = {
    'projection': 'merc',   # type of map projection
    'llcrnrlat': 28.,
    'urcrnrlat': 50.,
    'llcrnrlon': -130.,
    'urcrnrlon': -95.,
    'area_thresh': 10000,    #area threshold for coastlines
    'resolution': 'h'}       # resolution of coastline data ('c'oarse fine for global)

save_ext = 'png'
save_kwargs = {'dpi': 150, 'bbox_inches':'tight'}


def plot_map():
    """Plot the map"""


    # figure / map setup
    fig = plt.figure(**fig_config)
    ax = fig.add_axes([0,0,0.9,1.0])
    m = Basemap(ax=ax, **map_config)
    cp = m.drawmapboundary()


    for idd in range(0,len(sf.records())):
        shape_ex = sf.shape(idd)
        x_lon = np.zeros((len(shape_ex.points),1))
        y_lat = np.zeros((len(shape_ex.points),1))
        for ip in range(len(shape_ex.points)):
            x_lon[ip] = shape_ex.points[ip][0]
            y_lat[ip] = shape_ex.points[ip][1]
        # print(shape_ex)
        xm_lon, ym_lat = m(x_lon, y_lat)
        m.plot(xm_lon, ym_lat, zorder=6, color='k', lw=0.5)

    m.drawcoastlines(zorder=6)

    fname_out="usa_states.png"
    print("output fname: ",fname_out)
    plt.savefig(fname_out, **save_kwargs)
    plt.close()

########################################################################

if __name__ == '__main__':
    plot_map()
Recap
Without scrolling up — what are the steps?
- Read the state polygons from a shapefile (
shp.Reader), each as lon/lat point lists, - Project each polygon’s coordinates with the map object —
m(lon, lat) → (x, y), - Draw the projected outlines with
m.plot(...), plus coastlines and a map boundary.
The pattern generalizes to any shapefile overlay — swap in county lines, fault traces, or a data layer (e.g. COVID cases per state or a tomographic map) on top of the same base map.
Conclusion
This script can be very handy in plotting some data that has some relation with the states in the USA. These data can be categorical such as the number of COVID cases or spatial such as the seismic tomographic maps.
Where to go next
- Cartopy — the actively maintained successor to Basemap for projected maps.
- GeoPandas — read and plot shapefiles directly as GeoDataFrames.
- PyShp (
pyshp) — the low-levelshapefilereader used here.
Disclaimer of liability
The information provided by the Earth Inversion is made available for educational purposes only.
Whilst we endeavor to keep the information up-to-date and correct. Earth Inversion makes no representations or warranties of any kind, express or implied about the completeness, accuracy, reliability, suitability or availability with respect to the website or the information, products, services or related graphics content on the website for any purpose.
UNDER NO CIRCUMSTANCE SHALL WE HAVE ANY LIABILITY TO YOU FOR ANY LOSS OR DAMAGE OF ANY KIND INCURRED AS A RESULT OF THE USE OF THE SITE OR RELIANCE ON ANY INFORMATION PROVIDED ON THE SITE. ANY RELIANCE YOU PLACED ON SUCH MATERIAL IS THEREFORE STRICTLY AT YOUR OWN RISK.
Leave a comment